| The Wagner Daily ETF Report For June 10 |
| By Deron Wagner |
Published
06/10/2008
|
Stocks
|
Unrated
|
|
|
|
The Wagner Daily ETF Report For June 10
The Nasdaq played "catch-up" to the weakness in the S&P and Dow yesterday, while the latter indexes took a rest following the previous day's melee. The S&P 500 and Dow Jones Industrial Average managed modest gains of 0.1% and 0.6% respectively, but the Nasdaq Composite fell 0.6%. The small-cap Russell 2000 similarly lost 0.7%, as the S&P Midcap 400 dipped just 0.1%. A bounce in the final hour of trading enabled the Nasdaq to recover more than half its earlier intraday loss of 1.8% and finish in the middle of the day's range. The rest of the main stock market indexes also settled near the middle of their intraday trading ranges.
Total volume in the NYSE declined 9%, while volume in the Nasdaq eased 3% below the previous day's level. Market internals were negative, but not overly so. In both exchanges, declining volume exceeded advancing volume by a ratio of approximately 2 to 1. The underlying technicals were certainly much better than last Friday.
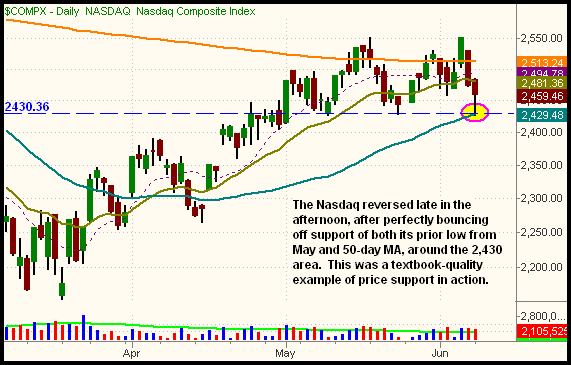
In yesterday morning's Wagner Daily, we illustrated how the Nasdaq Composite closed the previous day's session just below support of its three-month ascending trend channel. Traders subsequently took advantage of that key technical sign yesterday, selling shares that triggered a wave of downside momentum in the tech arena. By late afternoon, the Nasdaq had fallen to major support of both its 50-day moving average and prior low from May. Not surprisingly, that convergence of support at the 2,430 level gave traders a good excuse to buy. The confluence of support the Nasdaq bounced off of yesterday is shown on the daily chart below:

It's positive that the Nasdaq did what it was "supposed to do" by bouncing off a pivotal area of support yesterday, but the index is now convincingly below lower channel support of its prior uptrending channel (the dashed blue line on the chart above). Since prior support becomes new resistance after the support is broken, expect the Nasdaq to have significant difficulty attempting to move back above yesterday's high. If the Nasdaq bounces today, you might consider liquidating any losing long positions that you failed to unload yesterday. Dipping a toe in the water on the short side of the Nasdaq may be a good idea as well. However, the chart patterns of the S&P and Dow are still much weaker than the Nasdaq, thereby presenting lower risk of loss in the event of a broad-based reversal. Nevertheless, if the Nasdaq breaks firmly below yesterday's low, which would include a breach of its May low and 50-day MA as well, expect selling pressure in the tech sectors to intensify quite a bit.
The S&P 500 and Dow Jones Industrial Averages both closed a bit higher yesterday, but their gains paled in comparison to their previous day's losses. Because neither index managed to make up much ground yesterday, the ultra near-term patterns are basically consolidations near their recent lows. If the major indices fail to close above yesterday's highs in today's session, the odds of another move lower in the coming days will be pretty decent. Of course, given that the Dow has already retraced nearly two-thirds of its gain from the March low to May high, we also cannot rule out the possibility of a sudden blowout to test the pivotal March lows in the blink of an eye.
The Market Vectors Russia (RSX) and iShares Latin America (ILF) are two international ETFs that have been showing relative strength to the U.S. broad market. Although both ETFs moved lower alongside of the domestic markets last week, their chart patterns are still healthy. RSX is holding above support of both its 20 and 50-day MAs. ILF is trading marginally below its 20-day EMA, but is still above its 50-day MA. We'll monitoring RSX for a potential long entry on a breakout above its near-term hourly downtrend line, but that's not likely to happen today. When the market eventually shows signs of stabilization again, we'll update you on the best ETFs with buyable near-term patterns. Until then, new long positions carry too negative a risk/reward ratio to mess with.
In the pre-market today, the S&P 500 and Nasdaq 100 futures are trading sharply lower. As such, be prepared for the major indices to possibly open below yesterday's lows. If that occurs, the bulls who bought the Nasdaq's late-day bounce off its 50-day MA will quickly become trapped, forcing them to sell. This could spark a wave of downward momentum if stocks are unable to quickly recover within the first hour of trading. Stay alert, honor your protective stops, and don't fall into "hope" mode. Failure to do these three things will put you in great danger of small, insignificant losses spiralling out of control, creating significant damage to your trading account.
Open ETF positions:
Long - DXD, DUG
Short - (none)
Deron Wagner is the Founder and Head Trader of both Morpheus Capital LP, a U.S. hedge fund, and Morpheus Trading Group, a trader education firm launched in 2001 that provides daily technical analysis of the leading ETFs and stocks. For a free trial to the full version of The Wagner Daily or to learn about Wagner's other services, visit MorpheusTrading.com or send an e-mail to deron@morpheustrading.com.
|