|
The Wagner Daily ETF Report For June 6
Stocks staged a broad-based rally yesterday, enabling several of the major indices to move above key resistance levels. After trending higher throughout the morning, the main stock market indexes initially began to follow their recent trend of selling off in the afternoon, but this time the bulls took control into the close. Stocks moved back to their mid-day highs and continued north in the final ninety minutes of trading. The S&P 500 zoomed 2.0% higher, the Nasdaq Composite climbed 1.9%, and the Dow Jones Industrial Average gained 1.7%. Small and mid-cap stocks performed best, as the Russell 2000 and S&P Midcap 400 indices rallied 2.6% and 2.3% respectively. For the first time in a week, all the major indices closed at their best levels of the day.
Yesterday's percentage gains were impressive, but it's negative that the rally was not accompanied by higher turnover. Total volume in the NYSE eased 6%, while volume in the Nasdaq was on par with the previous day's level. Increased volume would have indicated an appetite for stocks among institutional funds, but that wasn't the case. Nevertheless, trading in both exchanges remained above 50-day average levels. Market internals were also quite solid. In both the NYSE and Nasdaq, advancing volume beat declining volume by a margin of more than 5 to 1.
Two days ago, we illustrated the bearish setup in the S&P Energy SPDR (XLE), as well as the bullish setup in the inversely correlated UltraShort Oil and Gas ProShares (DUG). Later that day, XLE performed as expected by falling below its short-term consolidation. Conversely, DUG followed-through with a breakout above its recent range. Yesterday, however, a surprising 3.6% surge in the Amex Oil Index ($XOI) caused both ETFs to swiftly reverse course. The May 29 bearish action in the price of the crude oil commodity, which we pointed out in the May 30 issue of The Wagner Daily, indicated the likelihood of at least a short-term top. But recall we also warned that trying to sell short bearish reversals in strong sectors is often tricky because bullish momentum doesn't die quickly.
DUG, which we bought on June 3, is now looking like a failed breakout pattern. It's still a few cents above our stop price, but we plan to cut the loss quickly if it moves much below yesterday's low. The daily chart of DUG is shown below:
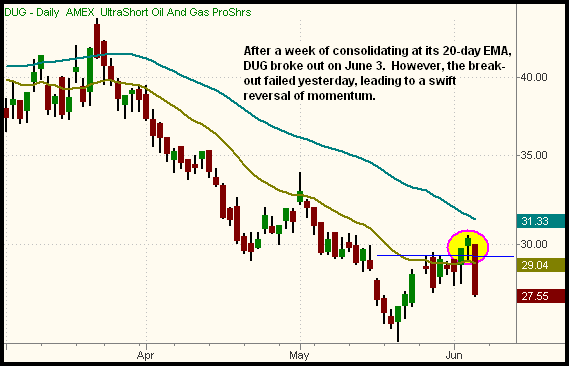
Failed breakouts often reverse quickly because the bulls who bought the breakout become trapped and are quickly forced to sell, thereby attracting the interest of the short sellers as well. Crude oil, as well as the oil-related indexes, could still form "lower highs" on their daily charts and resume their recent weakness, but yesterday's sharp reversal of momentum means all bets are off for new bearish positions in the energy sector.
In our June 4 commentary, we said the following about the previous day's price action in the Securities Broker-Dealer Index ($XBD), "...the $XBD Index similarly dipped below key support of its prior low from last month, but reversed to close above it. When ETFs trade briefly trade below key support levels, but reverse to close above them, it is known as an "undercut." Undercuts are bullish and often lead to swift reversals higher because they trap the bears who sold short the expected break down to a new low, forcing them to quickly cover their short positions. This, in turn, attracts the value buyers, who spot a low-risk opportunity in buying an ETF that has undercut a prior low. This all serves for reversals to quickly happen." Now, take a look at yesterday's subsequent price action in the $XBD index:
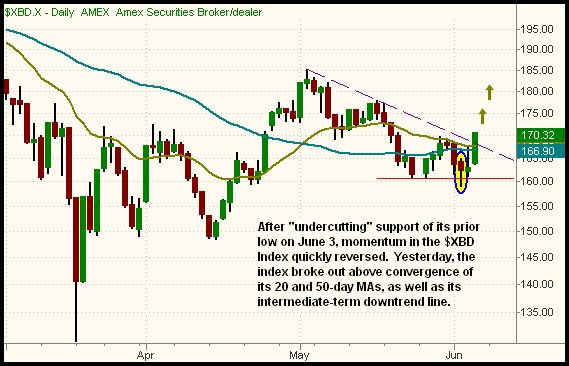
As you can see, the June 3 failed breakdown below support led to an immediate reversal of momentum and a strong breakout above resistance just two days later. The $XBD index has moved firmly above convergence of its 20 and 50-day moving averages, and has also broken out above its intermediate-term downtrend line (the dashed line). Within a period of just two days, the $XBD has gone from looking like a good short setup to looking like a good buy setup. This is why we recently suggested avoiding trading in the UltraShort Financial ProShares (SKF), unless you're strictly daytrading it. If you're thinking the June 3 failed breakdown in the $XBD Index is the inverse of what happened with yesterday's failed breakout in DUG, you're correct! Just as the failed breakdown in the $XBD Index led to sharply higher prices two days later, the high possibility of a further drop in DUG is why we said it should not be held much more than a few cents below yesterday's low.
Despite yesterday's 1.7% gain, the laggard Dow Jones Industrial Average is still below resistance of both its 20 and 50-day moving averages, as well as its prior high from last week. If the bears happen to resume control, the Dow should continue to be a downside leader. Though it fell back to our original entry point, we're still long the UltraShort Dow 30 ProShares (DXD). We've kept a loose stop on DXD, below the May 29 low, because we are looking to capture a significant gain. Larger price targets and longer holding times require looser stops than short-term "momentum" trades.
The Nasdaq Composite, on the other hand, broke out to close at its highest level since January 3 of this year, although it's still a couple points below the intraday high of May 19. If it moves any higher, the "head and shoulders" pattern we've been discussing will be invalidated, thereby increasing bullish momentum. If buying the stock market, consider focusing your efforts on the Nasdaq-related sectors such as the Semiconductor Index ($SOX). As per yesterday morning's commentary, we bought the Semiconductor HOLDR (SMH) when it moved above the high of its recent consolidation.
For technical traders, the bad thing about yesterday's rally is that the S&P 500 is now in "no man's land." The index cruised back above its 20 and 50-day moving averages, but closed right below resistance of its prior high from last week. The S&P is also near the middle of its range from the mid-May peak to the early June low. As for the near-term direction of the index, both the bulls and bears could make sound arguments regarding the next anticipated direction of the S&P 500.
With the S&P 500 in "no man's land," the Dow still below major resistance levels, and the Nasdaq trying to break out to a new intermediate-term high, the major indices are obviously out of sync with one another. Whenever this occurs, trading typically becomes whippy and indecisive. To reduce risk, consider taking the following action: reduce share size on all new trades, maintain a minimal number of open positions, and have positions on both sides of the market (long the ETFs with relative strength, short those with relative weakness).
Open ETF positions:
Long - SMH, DXD, DUG
Short - (none)
Deron Wagner is the Founder and Head Trader of both Morpheus Capital LP, a U.S. hedge fund, and Morpheus Trading Group, a trader education firm launched in 2001 that provides daily technical analysis of the leading ETFs and stocks. For a free trial to the full version of The Wagner Daily or to learn about Wagner's other services, visit MorpheusTrading.com or send an e-mail to deron@morpheustrading.com.
|


 Free Festival of Traders Videos