| The Wagner Daily ETF Report For June 2 |
| By Deron Wagner |
Published
06/2/2008
|
Stocks
|
Unrated
|
|
|
|
The Wagner Daily ETF Report For June 2
The major indices concluded the week with little fanfare, as stocks lethargically drifted sideways, in a very tight range, throughout all of last Friday's session. The Nasdaq Composite continued to show relative strength by climbing 0.6%, but the divergent Dow Jones Industrial Average slipped 0.1%. The broad-based S&P 500 ticked 0.2% higher. The small-cap Russell 2000 and S&P Midcap 400 indices gained 0.4% and 0.7% respectively. A brief wave of selling into the closing bell caused the Nasdaq to finish just above the middle of its narrow intraday range. The S&P 500 and Dow Jones Industrial Average settled in the bottom third of their ranges.
Total volume in the NYSE swelled 15% above the previous day's level, while volume in the Nasdaq increased 10%. Although both the S&P and Nasdaq gained on higher volume, it's important to note that turnover in both exchanges was actually on pace to be lighter than the previous day until the final fifteen minutes of trading. As the closing bell approached, a massive number of shares changed hands, causing trading to exceed the prior day's levels. Unfortunately, that burst of trading activity was selling volume because the broad market dropped sharply in the final minutes of trading.
Although buying interest was a bit subdued last week, the main stock market indexes generally moved higher. However, the bounce off the previous week's lows now positions the broad market for a possible resumption of the intermediate-term downtrend that began on May 19. If the major indices fall to break their prior lows from May 27, a "lower high" and two "lower lows" will be formed, increasing the chances of a move back down to test the March 2008 lows.
At the beginning of last week, we predicted a near-term bounce from the prior week's sell-off, but expected various overhead resistance levels to prevent stocks from gaining much upside momentum. So far, that's how everything has played out. The "head and shoulders" pattern in the Nasdaq that we pointed out last week is still technically intact, as the right shoulder remains below the head. The S&P 500 has begun to stall at resistance of its 50% Fibonacci retracement. The laggard Dow Jones Industrial Average still has the weakest chart pattern of the broad-based indexes. The daily chart of the Dow is shown below:
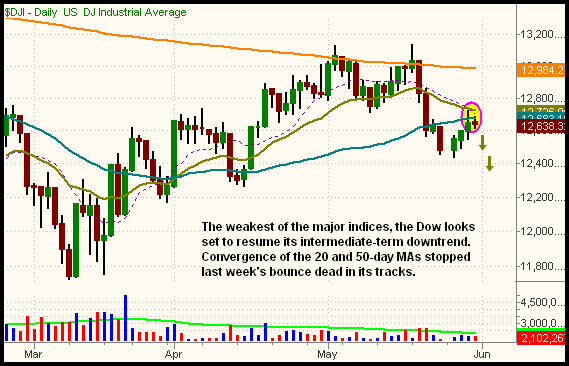
After an intraday "stop hunt" above its 50-day MA on May 29, the index finished the day below the 50-MA. Then, on May 30, the 50-day MA put the brakes on any rally attempt in the Dow, as the 50-day MA marked the intraday high of the Dow. A move below the May 30 low should trigger downside momentum that leads to a retest of last week's lows within the next several days. We still have just half a position of the UltraShort Dow 30 ProShares (DXD), but plan to buy the remaining shares when/if the Dow breaks the May 30 low. With both the 20 and 50-day MAs overhead, this seems a pretty likely scenario.
In addition to shorting the Dow, the various financial sectors continue to show relative weakness. As financials have been leading the S&P and Dow for many months now, the direction of the financials is likely to directly affect the whole market. If financials happen to break down this week, we'll be looking for an entry point in the inversely correlated UltraShort Financials ProShare (SKF), which gently pulled back to support of its 20-day EMA last Friday. However, it finished the day at its intraday high, and its hourly chart looks set to resume the intermediate-term uptrend that began with the May 2 low.
Open ETF positions:
Long - DXD (half position)
Short - (none)
Deron Wagner is the Founder and Head Trader of both Morpheus Capital LP, a U.S. hedge fund, and Morpheus Trading Group, a trader education firm launched in 2001 that provides daily technical analysis of the leading ETFs and stocks. For a free trial to the full version of The Wagner Daily or to learn about Wagner's other services, visit MorpheusTrading.com or send an e-mail to deron@morpheustrading.com.
|


 Free Festival of Traders Videos