| The Wagner Daily ETF Report For May 19 |
| By Deron Wagner |
Published
05/19/2008
|
Stocks
|
Unrated
|
|
|
|
The Wagner Daily ETF Report For May 19
After opening higher last Friday morning, stocks sold off throughout the morning, but an afternoon recovery enabled the major indices to finish with mixed results. The S&P 500 gained 0.1%, the Nasdaq Composite lost 0.2%, and the Dow Jones Industrial Average was flat. The small-cap Russell 2000 fell 0.3%, as the S&P Midcap 400 advanced the same percentage. Impressively, it was the seventh straight day of gains for the mid-cap index. Most of the main stock market indexes closed near their best levels of the day and the week.
Total volume in the NYSE surged 15% above the previous day's level, while volume in the Nasdaq increased just 3%. Since both the S&P and Nasdaq were little changed, the higher turnover was indicative of "churning," which we discussed last week. However, much of the volume increase was likely due to the monthly expiration of options. When options contracts expire on the third Friday of each month, the stock market usually sees higher volume as options traders jockey their positions. In both exchanges, advancing volume was roughly on par with declining volume. Neither the bulls nor bears firmly had the upper hand.
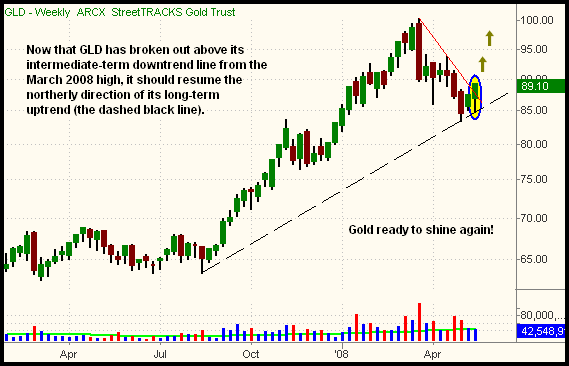
In the May 16 issue of The Wagner Daily, we pointed out the bullish setup in the StreetTRACKS Gold Trust (GLD). GLD subsequently opened sharply higher, consolidated throughout Friday's session, and finished with a 2.4% gain. This enabled GLD to break out firmly above resistance of its intermediate-term downtrend line that began with its March 2008 peak. GLD also reclaimed its 20-day exponential moving average. The break of the intermediate-term downtrend line should enable GLD to resume its long-term uptrend. This is shown on the weekly chart below (moving averages removed to more easily see the trendlines):

We view last Friday's strength in gold as very significant, as the breakout above the downtrend line could enable the precious metal to rally back to test its all-time high set just two months ago. Our long position in GLD, which we bought on May 15, is now showing an unrealized gain of 1.8 points. Our first price target is resistance of the prior highs of April 2008, just above the $93 level.
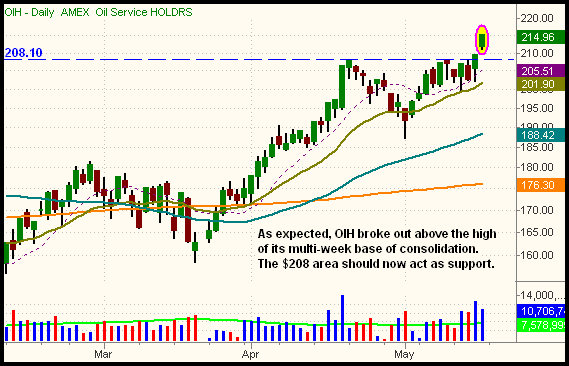
The Oil Service HOLDR (OIH), which we also discussed in last Friday morning's commentary, followed through and broke out above the high of its multi-week consolidation. Prior resistance of the high of the consolidation, around the $208 area, should now act as support on any pullback. As previously suggested, consider treating OIH as a quick, momentum-based trade if you bought last Friday's breakout. Trailing stops can be used to maximize gains while protecting profits. On short-term momentum trades, we often use a break below the 20-period exponential moving average on the hourly chart as a trailing stop. The OIH breakout and new horizontal price support is shown on the daily chart below:

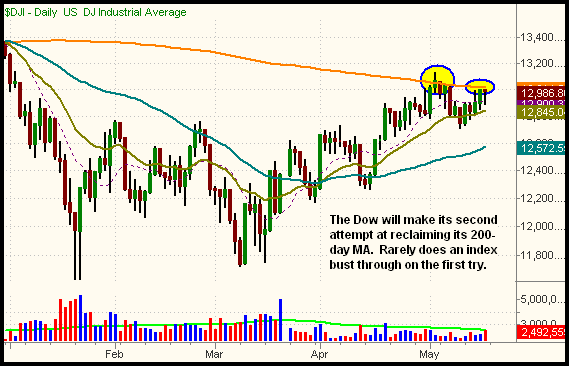
This week, traders will certainly be watching the price action of the S&P 500 as it tests key resistance of its 200-day moving average. With the index closing just two points below its 200-day MA last Friday, we'll likely see the first test today. The Dow Jones Industrial Average, which pulled back after the initial test of its 200-day MA on May 2, is also ready for another critical test of resistance. The daily charts of both indexes are shown below:


Now that the S&P and Dow have come this far, we could at least expect an intraday probe above their 200-day MAs. Whether or not they manage to close above their 200-day MAs is another story. Rarely will a breakout above the 200-day MA be successful on the first attempt. Rather, it's common for indexes, stocks, and ETFs to close above their 200-day MAs for one or two days, attract the "late to the party" bulls, then fall back down a few sessions later. There's a greater chance a breakout above the 200-day MA will "stick" on successive attempts. As such, it will be interesting to see the outcome of the Dow's second test of its 200-day MA this month. Stay alert this week, as a confirmed breakout above the 200-day MAs could trigger substantial short covering in the market. Conversely, an inability of the S&P and Dow to bust through their 200-day MAs could quickly lead to substantial selling pressure. It's time for the benchmark S&P 500 and Dow Jones Industrial Average to "make it or break it!"
Open ETF positions:
Long - GLD, DXD, UUP
Short - (none)
Deron Wagner is the Founder and Head Trader of both Morpheus Capital LP, a U.S. hedge fund, and Morpheus Trading Group, a trader education firm launched in 2001 that provides daily technical analysis of the leading ETFs and stocks. For a free trial to the full version of The Wagner Daily or to learn about Wagner's other services, visit MorpheusTrading.com or send an e-mail to deron@morpheustrading.com.
|