|
The Wagner Daily ETF Report for April 24
An impressive 4.1% advance in the Philadelphia Semiconductor Index ($SOX) helped the Nasdaq recover nearly all of the previous day's loss, but the S&P and Dow lagged behind. Trading in a choppy and indecisive fashion throughout yesterday's session, the Nasdaq Composite eventually finished 1.2% higher. The S&P 500 and Dow Jones Industrial Average posted matching gains of just 0.3%. The small-cap Russell 2000 and S&P Midcap 400 indices rallied 0.6% and 0.4% respectively. Though the Nasdaq settled in the upper quarter of its intraday range, the S&P 500 and Dow Jones Industrials showed bearish divergence by closing just below the middle of their trading ranges.
Turnover was mixed. Total volume in the NYSE was 1% lower than the previous day's level, but the Nasdaq's trading was 10% more active. The mixed volume levels had different implications on the technical state of the market. For the Nasdaq, the higher volume was bullish because the index also gained more than one percent. This enabled the Nasdaq Composite to register its fourth bullish "accumulation day" in just over a week. But it's negative for the S&P 500 and Dow Jones Industrials that a session of lower volume gains followed a day of higher volume selling ("distribution day") in the NYSE. Market internals also were quite divergent. In the Nasdaq, advancing volume exceeded declining volume by nearly 3 to 1. Conversely, the advancing/declining volume ratio in the NYSE was marginally negative.
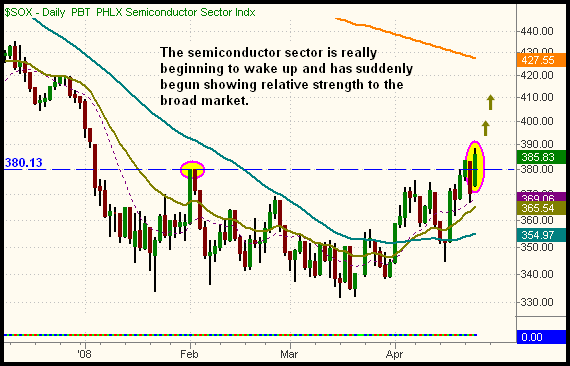
After trading in a stagnant, sideways range throughout the first quarter of this year, the $SOX index began to wake up earlier this month. On April 1, the $SOX rallied to close above its 50-day moving average for the first time in nearly six months. Because of that breakout, we bought one of the semiconductor ETFs at the time, but the semiconductor sector failed to gain any momentum. The $SOX fizzled out and gave back its gains two weeks later. However, the index quickly found support at its 50-day MA. (Remember that a prior level of resistance becomes the new support level after the resistance is broken.) Since bouncing off its 50-day MA on April 15, the index has been climbing steadily higher. Yesterday, the $SOX showed significant relative strength to the broad market by surging 4.1% higher. More importantly, the index closed above resistance of its February high, a key level of horizontal price resistance that could trigger further upside momentum in the $SOX. This is shown on the daily chart of the $SOX below:

Assuming the overall stock market holds up okay in the coming days, stocks and ETFs in the $SOX index can be bought here with a relatively low degree of risk and a positive reward/risk ratio. The various semiconductor ETFs to consider are: Semiconductor HOLDR (SMH), iShares Semiconductor (IGW), PowerShares Semiconductor (PSI), SPDR S&P Semiconductor (XSD), and ProShares Ultra Semiconductor (USD). Of these, the chart of XSD most closely resembles the $SOX Index, but PSI has had the most bullish divergence to the $SOX this year. Unfortunately, none of these ETFs are exhibiting major relative strength to the $SOX.
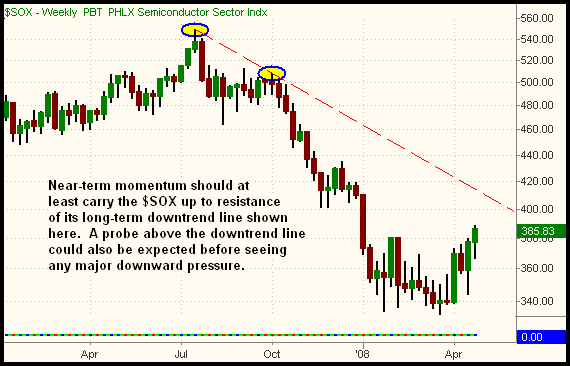
At a minimum, we expect the $SOX to at least test resistance of its weekly downtrend line that began with the highs of July 2007. This long-term downtrend line is shown on the weekly chart of the $SOX below:

Presently, resistance of the primary downtrend line is around the 413 level, about 7% above yesterday's closing price. If the $SOX manages to probe above its weekly downtrend line, further resistance of the 200-day MA awaits just a bit higher. With such major resistance levels, we certainly are not advocating a long-term bullish stance on the sector. Rather, we are bringing to your attention a short-term momentum trading opportunity. If the $SOX maintains the type of relative strength it showed yesterday, it won't take more than a couple of days to rally into its weekly downtrend line. At that time, we could either sell into strength for a quick profit, or merely trail tight stops to protect gains.
In addition the semiconductor sector, we are still monitoring DB Commodity Index Tracking Fund (DBC) for a potential breakout to a new all-time high. We pointed out the setup in yesterday morning's commentary, but it didn't go anywhere in yesterday's session. If DBC moves above the April 22 high, we plan to buy. We also are looking for a possible entry in the iShares Xinhua China 25 Index Fund (FXI). It jumped approximately 8% yesterday, gapping up above several months of horizontal price resistance and closing above its 200-day MA. Volume also surged to its highest level in more than a month, confirming the institutional demand. To buy FXI, we're ideally looking for a pullback to the 20-MA on the hourly chart (near yesterday's low), or at least a day or two of sideways price consolidation. (Note that a rogue after-hours print yesterday caused the "official" closing price of FXI to deceptively be nearly two points lower than its actual 4:00 pm ET closing price.)
As for the broad market, the near-term charts of the Nasdaq Composite and Nasdaq 100 indices are looking better than the S&P 500 and Dow Jones Industrials. If, for example, the Nasdaq 100 rallies above yesterday's high, it will break out above a tight, four-day base of consolidation. If that happens, we may consider buying the Nasdaq 100 Tracking Stock (QQQQ) for a quick momentum trade with a 1 to 3 day holding time, placing a protective stop just below yesterday's low. Obviously, continued relative weakness in the S&P and/or Dow would make it more difficult for the Nasdaq to steadily move much higher, so just take it easy with all new trade entries here. Above all else, simply trade what you see, not what you think!
Open ETF positions:
Long - (none)
Short - (none)
Deron Wagner is the Founder and Head Trader of both Morpheus Capital LP, a U.S. hedge fund, and Morpheus Trading Group, a trader education firm launched in 2001 that provides daily technical analysis of the leading ETFs and stocks. For a free trial to the full version of The Wagner Daily or to learn about Wagner's other services, visit MorpheusTrading.com or send an e-mail to deron@morpheustrading.com.
|