| The Wagner Daily ETF Report for April 9 |
| By Deron Wagner |
Published
04/9/2008
|
Stocks
|
Unrated
|
|
|
|
The Wagner Daily ETF Report for April 9
Stocks closed moderately lower across the board yesterday, but the major indices held within support of their recent trading ranges. The Dow Jones Industrial Average slipped 0.3%, the S&P 500 0.5%, and the Nasdaq Composite 0.7%. Both the small-cap Russell 2000 and S&P Midcap 400 indices gave up just 0.1%. All the losses were the result of a broad-based opening gap down, as stocks subsequently meandered in a tight, sideways range throughout the entire day before closing near the middle of their intraday ranges.
Turnover in both exchanges declined modestly. Total volume in the NYSE was 6% lower than the previous day's level, while volume in the Nasdaq similarly eased by 5%. In both the NYSE and Nasdaq, it was the single lowest volume day of the year. This is positive, as it shows that mutual funds, hedge funds, and other institutional players were not behind yesterday's selling. Instead, they simply remained on the sidelines, waiting to join the buy side on the stock market's next "up" day. The Nasdaq is a perfect example of a bullish price to volume relationship. Turnover spiked higher when the index broke out on April 1, but has declined in each of the past five days the index has consolidated near that day's high. To continue this bullish pattern, trading activity should significantly increase when the broad market eventually scores its next solid day of gains.
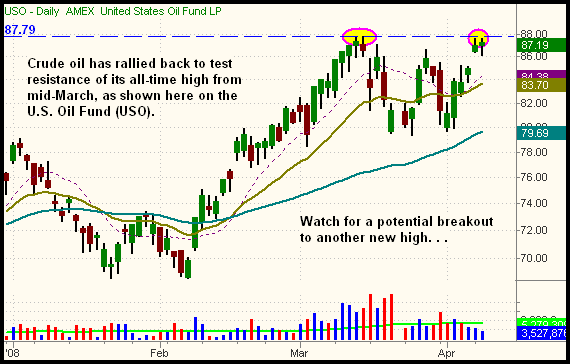
The crude oil commodity has rallied back to test its all-time high from mid-March. If oil is able to move above resistance of its record high, another intermediate-term uptrend could follow. One of the easiest and best ways to play a bullish move in the price of crude oil is through the U.S. Oil Fund (USO), which roughly mirrors the price movement of crude oil. The test of the prior high from mid-March is shown on the daily chart of USO below:

On a technical level, nothing really changed yesterday. ETFs we've pointed out as bullish setups over the past few days ticked a bit lower, but remained within support of their recent trading ranges. The same could be said of the major indices, each of which have refused to give up more than a small portion of their April 1 gains thus far. In yesterday's commentary, we said of the stock market's tight, sideways range, "While this consolidation is indeed bullish, stocks must now prove they are capable of following through on the breakout above key resistance levels that occurred last week." Sooner or later, the bulls will make a valiant effort to push stocks to new near-term highs. When that day comes, the price and volume action will tell us more about the true momentum in the market. Until that happens, we remain lightly positioned on the long side, ready to buy more stocks and ETFs when the market tells us to do so.
Open ETF positions:
Long - IYT, INP
Short - (none)
Deron Wagner is the Founder and Head Trader of both Morpheus Capital LP, a U.S. hedge fund, and Morpheus Trading Group, a trader education firm launched in 2001 that provides daily technical analysis of the leading ETFs and stocks. For a free trial to the full version of The Wagner Daily or to learn about Wagner's other services, visit MorpheusTrading.com or send an e-mail to deron@morpheustrading.com.
|