| The Wagner Daily ETF Report for April 8 |
| By Deron Wagner |
Published
04/8/2008
|
Stocks
|
Unrated
|
|
|
|
The Wagner Daily ETF Report for April 8
Yesterday's action was basically a repeat of the previous day's. The major indices moved higher throughout the morning, tested the highs of their recent consolidations at mid-day, then drifted back down in the afternoon. Stocks again finished with mixed results and near the flat line. The S&P 500 gained 0.2%, the Nasdaq Composite lost 0.3%, and the Dow Jones Industrial Average was unchanged. The small-cap Russell 2000 slipped 0.2%, but the S&P Midcap 400 continued to show relative strength by gaining 0.3%. The main stock market indexes closed in the bottom third of their intraday ranges.
Total volume in the NYSE increased 3%, while volume in the Nasdaq was 10% lighter than the previous day's level. Although the S&P 500 advanced slightly, its percentage gain was not significant enough to label the session a bullish "accumulation day," especially since the index closed near the bottom of its intraday range. Turnover in the Nasdaq ticked lower for a fourth straight session, but that's fine because the index remains in consolidation mode. Advancing volume in the NYSE exceeded declining volume by 3 to 2. The Nasdaq adv/dec volume ratio was negative by about the same margin.
Yesterday afternoon, we sold our long position in the iShares Xinhua China 25 (FXI) for a 6.6 point gain. Although we only entered the trade on April 2, we made a judgment call to take profit because we are not interested in holding through a correction. Since it has rallied more than 20% off its low in just two weeks, a pullback is likely in the near-term. After it consolidates or pulls back, we can simply re-enter FXI if it still looks good. Along with FXI, we also sold the iShares Taiwan Index (EWT) for a loss of just a quarter point. We sold because its performance has been disappointing since our entry. It has also lost its relative strength. It was better to just sell EWT into yesterday's bounce and cut the small loss.
With more capital in our model account now freed up, we are stalking the iShares Mexico Index (EWW) for potential long entry. Unlike FXI, which is still well off its high and trying to reverse its six-month downtrend, EWW is consolidating less than five percent below its all-time high. It has shown great relative strength since breaking out on April 1, consolidating in a tight, sideways range near its recent high. The daily chart of EWW is shown below:
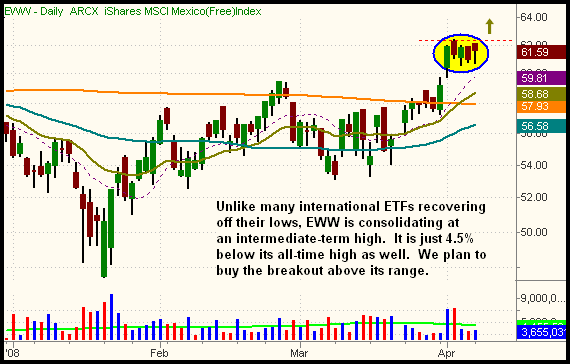
With the 10-day MA (the purple dashed line) closing in from below, EWW should soon break out above the high of its short-term consolidation. When it does, we plan to buy. Though international ETFs such as FXI may rally a greater percentage when they move, EWW has much less overhead supply because it is trading near its high.
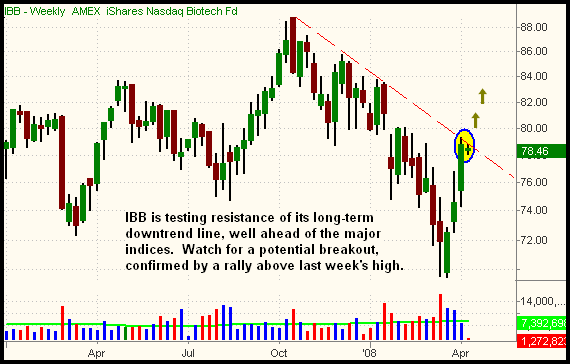
While the broad market has been in a sideways range over the past four days, the Biotech Index ($BTK) has shown relative strength by steadily moving higher. The iShares Nasdaq Biotech Fund (IBB) has followed a similar pattern. More importantly, IBB is now testing resistance of its long-term downtrend line. If it moves above last week's high of $79.31, IBB will have reversed the direction of its primary trend. Meanwhile, the S&P, Nasdaq, and Dow remain well below their long-term downtrend lines (as analyzed in yesterday's commentary). The potential breakout is illustrated on the weekly chart of IBB below:
The S&P 500 is already showing a gain of 3.7% in the first week of April, but remember the entire gain occurred on just one day (April 1). Since then, the broad market has done nothing other than chop around in the vicinity of its April 1 high. While this consolidation is indeed bullish, stocks must now prove they are capable of following through on the breakout above key resistance levels that occurred last week. The bulls still have the upper hand in the short-term, but the fact that intraday rallies have failed in each of the past two afternoons makes us more cautious. Although the market has not given us any reason to enter new short positions, it may be wise to tighten stops on existing long positions. When last week's rally confirms itself by stocks closing at new near-term highs, we'll be more confident about staying on the long side of the market in the intermediate-term.
Open ETF positions:
Long - IYT, INP
Short - (none)
Deron Wagner is the Founder and Head Trader of both Morpheus Capital LP, a U.S. hedge fund, and Morpheus Trading Group, a trader education firm launched in 2001 that provides daily technical analysis of the leading ETFs and stocks. For a free trial to the full version of The Wagner Daily or to learn about Wagner's other services, visit MorpheusTrading.com or send an e-mail to deron@morpheustrading.com.
|


 Free Festival of Traders Videos