| The Wagner Daily ETF Report for March 28 |
| By Deron Wagner |
Published
03/28/2008
|
Stocks
|
Unrated
|
|
|
|
The Wagner Daily ETF Report for March 28
It was a tug-of-war between the bulls and bears yesterday, as the stock market see-sawed throughout the entire session. The bears eventually grabbed the upper hand, causing the main stock market indexes to post significant losses and finish near their worst levels of the day. The Nasdaq Composite lost its relative strength and fell 1.9%. The S&P 500 and Dow Jones Industrial Average lost 1.2% and 1.0% respectively. The small-cap Russell 2000 closed 1.4% lower. The S&P Midcap 400 Index similarly declined 1.2%.
Turnover rose across the board, causing both the NYSE and Nasdaq to register a bearish "distribution day." Total volume in the NYSE increased 3%, while volume in the Nasdaq rose 6% above the previous day's level. After two consolidation days on declining volume, yesterday's losses on higher volume hinted at the first instance of institutional selling. However, note that volume was also tracking higher when the broad market rallied into positive territory at mid-day. This tells us institutional buying was also present earlier in the day. Market internals were obviously negative, but not by an overwhelming margin. In the NYSE, declining volume exceeded advancing volume by 3 to 1. The Nasdaq ratio was negative by 4 to 1. Again, the session was really just a tug-of-war in which the bears ascertained the longer end of the rope by the closing bell.
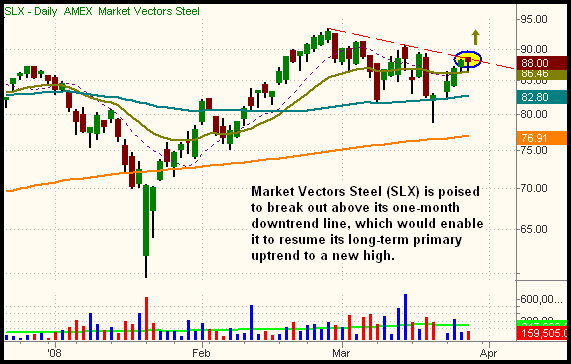
You may want to keep an eye on the Market Vectors Steel (SLX) today, as it positioned for a bullish move in the near-term. Its daily chart is shown below:

Last month, SLX showed great relative strength by moving to a fresh all-time high in the face of a weak broad market. It subsequently entered into a gentle, three-week correction that ended when SLX formed a bullish "hammer" and bounced off support of its 50-day MA. After climbing steadily off its 50-day MA, it eventually posted a lower close yesterday, but only by 5 cents. Considering the 1.2% loss in the S&P 500, it showed great relative strength. More importantly, it is poised to break out above resistance of its one-month downtrend line (the red dashed line). A firm rally above yesterday's high should at least send SLX back to its 52-week high, with good odds of breaking out to a fresh record high.
Considering the bullish near-term patterns on the daily charts of the major indices, yesterday's action was a bit disappointing. But considering how far stocks have rallied off their lows in such a short period of time, the pullback still isn't very deep. Long-time followers of this column already know that Fibonacci retracements are one of the most accurate ways to predict the likelihood of a trend resuming in its primary direction after a correction occurs. Despite yesterday's losses, the S&P, Nasdaq, and Dow are each holding above their respective 38.2% Fibonacci retracment levels. This is found by measuring their current prices, in relation to the rally from their March 17 lows to March 24/25 highs. Further, the 20-day EMAs are still acting as support for the major indices, although the 50-day MAs were slightly violated yesterday.
The direction of the main stock market indexes over the next 1 to 3 days will likely determine the trend of stocks throughout the next month. Overall, the technicals still favor short to intermediate-term strength. But if the the major indices begin retracing more than 61.8% of their recent gains, it could get really ugly. New lows would likely follow in short order. As long as one maintains discipline to adhere to predetermined stop loss prices, the risk/reward to the upside is quite positive, and the danger of sustaining big losses is minimal. This, of course, is only true if one manages the trading account like a disciplined, professional trader. Falling into "hope" mode when the going gets rough is a loser's game.
Open ETF positions:
Long - QLD, IYT, EWT, INP
Short - (none)
Deron Wagner is the Founder and Head Trader of both Morpheus Capital LP, a U.S. hedge fund, and Morpheus Trading Group, a trader education firm launched in 2001 that provides daily technical analysis of the leading ETFs and stocks. For a free trial to the full version of The Wagner Daily or to learn about Wagner's other services, visit MorpheusTrading.com or send an e-mail to deron@morpheustrading.com.
|