| The Wagner Daily ETF Report for March 27 |
| By Deron Wagner |
Published
03/27/2008
|
Stocks
|
Unrated
|
|
|
|
The Wagner Daily ETF Report for March 27
Stocks pulled back moderately yesterday, but the major indices held within the consolidation of their recent highs. The broad market opened lower, then chopped around in a relatively narrow range throughout the entire day. The Nasdaq Composite lost 0.7%, as both the S&P 500 and Dow Jones Industrial Average shed 0.9%. The small-cap Russell 2000 and S&P Midcap 400 indices declined 0.5% and 0.8% respectively. Most of the stock market indexes closed near their opening prices, and intraday volatility was rather low for a second straight day.
Total volume in the NYSE was 4% lower than the previous day's level, while volume in the Nasdaq similarly eased 9%. Not only was it the third consecutive session of lighter turnover, but it was also the Nasdaq's lowest volume day of the year. The minimal trading activity tells us the bulls were on the sidelines, but the bears still weren't interested in selling. It's bullish that such light volume accompanied a gentle pullback from the stock market's recent gains. Conversely, higher volume would have been a warning sign that institutions were selling into strength of the current rally.
In yesterday morning's Wagner Daily, we said the S&P 500 may find support at its 20-period exponential moving average on the hourly chart. Even if it didn't, we said the near-term technical picture would remain bullish, just as long as the S&P held support of the previous day's low. How did it fare? The S&P dipped below its 20-EMA on the hourly chart, as well as the prior day's low, then closed right at Tuesday's low. The Nasdaq 100 Index similarly found support exactly at the previous day's low, but held above its 20-EMA on hourly chart as well.
If you're new to technical analysis, one of the best and easiest things to remember about support and resistance is this: the prior day's intraday lows will typically act as very near-term support, while the prior day's intraday highs provide near-term resistance. Yesterday's action in both the S&P 500 and Nasdaq 100 was a prime example of this. The exact touch of the previous day's low is shown on the hourly chart of the Nasdaq 100 below:
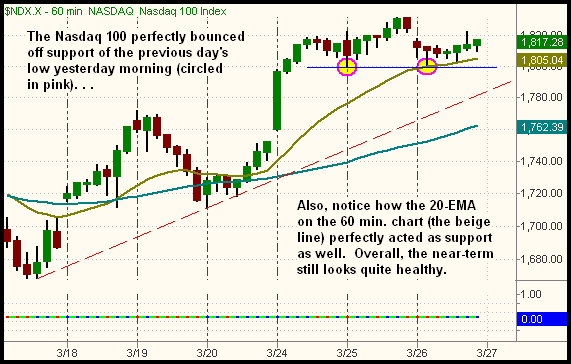
The Nasdaq 100 perfectly bounced off its prior day's low, but the S&P 500 dipped a few points below its prior low before eventually closing right on it. Is this a bad thing? Not at all! Frequently, specialists and market makers will cause swift probes below key support and resistance levels that other traders are watching. This is commonly referred to as a "stop hunt." It's frustrating if you fall victim to a stop hunt by selling at the bottom, but the reality is these probes below key support levels are actually bullish. When too much overhead supply exists, it's difficult for stocks and indexes to move higher without an abundance of buying pressure. The "stop hunts," however, shake out the "weak hands," those who are too skittish to hold through a pullback. When these people are gone, the market has less overhead supply to contend with on the next rally attempt. This makes it easier for the market to subsequently zoom to a new high. Those who just sold at the bottom thereafter find themselves chasing the bid on the way back up, further driving demand. Though it's never 100% fool-proof, we successfully avoid getting hit on "stop hunts" a majority of the time by simply giving our stops plenty of "wiggle room" below the obvious levels of support. If you place your stop just a few pennies below the obvious support, you're bound to get knocked out, time and time again.
Taking an updated look at the daily charts of the major indices, we see the formation of "bull flag" patterns just above the 50-day moving averages. This is most apparent on the daily chart of the Nasdaq Composite:
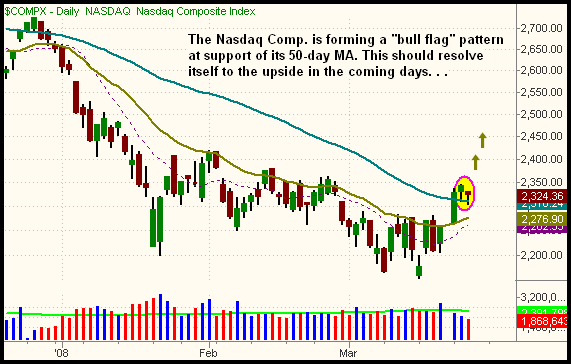
With the S&P, Nasdaq, and Dow all holding at their 50-day MAs, as well as new support of their prior intermediate-term downtrend lines, the near-term bias remains bullish. We view yesterday's pullback on lower volume as bullish. It undoubtedly shook out quite a few "weak hands," but institutions were not willing to sell. This is further evidenced by yesterday's relative strength in market-leading stocks such as iPod manufacturer Apple (AAPL), and Blackberry maker Research in Motion (RIMM). Both stocks scored solid gains despite a pullback in the broad market.
Open ETF positions:
Long - QLD, INP, EWT, IYT, DUG
Short - (none)
Deron Wagner is the Founder and Head Trader of both Morpheus Capital LP, a U.S. hedge fund, and Morpheus Trading Group, a trader education firm launched in 2001 that provides daily technical analysis of the leading ETFs and stocks. For a free trial to the full version of The Wagner Daily or to learn about Wagner's other services, visit MorpheusTrading.com or send an e-mail to deron@morpheustrading.com.
|


 Free Festival of Traders Videos