|
The Wagner Daily ETF Report for March 26
The main stock market indexes oscillated in a tight, sideways range throughout yesterday's session, as stocks digested their recent gains. Lazily drifting into the closing bell, the major indices finished with mixed results. The Nasdaq Composite continued to show relative strength by gaining 0.6%, as did the small-cap Russell 2000 Index. The Dow Jones Industrial Average slipped just 0.1%, while the broad-based S&P 500 ticked 0.2% higher. The S&P Midcap 400 advanced 1.0%. All the major indices closed in the upper third of their narrow intraday ranges.
Typical of bullish consolidation days, turnover eased across the board. Total volume in the NYSE decreased 8% below the previous day's level. The Nasdaq's volume was similarly 10% lighter. When the market trades sideways following a substantial rally, it's positive when it does so on lighter volume. This indicates that the bears did not sell into strength while the bulls took a rest. Conversely, higher volume during periods of consolidation is often indicative of bearish "churning." In order for the broad market's price to volume relationship to remain bullish, higher volume should accompany the next round of gains that follows the current consolidation.
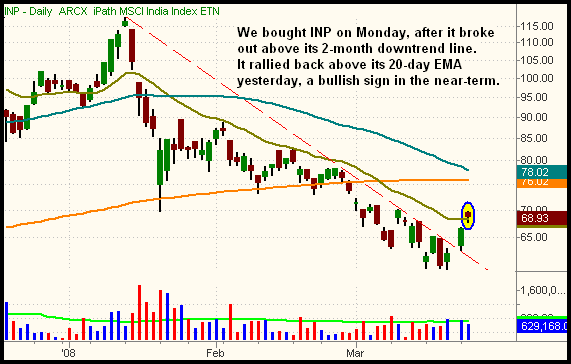
Many ETFs have started to break out above resistance of multi-month downtrend lines, providing us with quick, counter-trend momentum trading opportunities. ETFs that were former market leaders may bounce the most in the short-term. This is because investors often put their money back into the ETFs they remember as being strong. For this reason, we bought the iPath India Index (INP) on Monday, after it broke out above its two-month downtrend line. It subsequently moved higher yesterday, and is back above resistance of its 20-day EMA. This is shown on the daily chart below:

On several occasions over the past two months, notice how the 20-day EMA (the beige line) acted perfectly as resistance that eventually pushed INP to new lows. Now that it has reclaimed its 20-day EMA, that level should now provide price support. Remember that a prior resistance level becomes the new support level after the resistance is broken. Regardless, we're only looking to capture a short-term bounce to the area of the 200-day MA. If INP rallies to the $75 to $76 area, we plan to sell into strength. This would enable us to lock in a gain of nearly 10 points with a holding period of just a week or so. There is simply too much overhead supply to expect a larger gain in the near-term. Presently, the position is showing an unrealized gain of 2.7 points.
In addition to Monday's purchase of INP, we bought the iShares DJ Transportation (IYT) yesterday morning. We sent an Intraday Trade Alert to subscribers, informing them of our entry, after it pulled back to near support of the prior day's breakout level. It held that support quite well, and moved back to the previous day's high later in the day. Over the next several days, we expect IYT to make another leg up. Our long position in the ProShares Ultra QQQ (QLD) also continued to build on its gains yesterday. We'll soon trail a tighter stop to protect the gain and maximize profit along the way. Our long position in the UltraShort Oil and Gas ProShares (DUG) is against us by just 32 cents.
Although uneventful, yesterday's broad market action was quite healthy. After two days of strong gains, it's actually preferable for stocks to take a breather. This enables the stock market to build a new base of support from which to stage its next rally. When stocks rally too much without at least a short period of rest, it's easier for the market to give back those gains. Brief periods of consolidation in between rallies increases the likelihood of gains remaining intact, at least in the short-term.
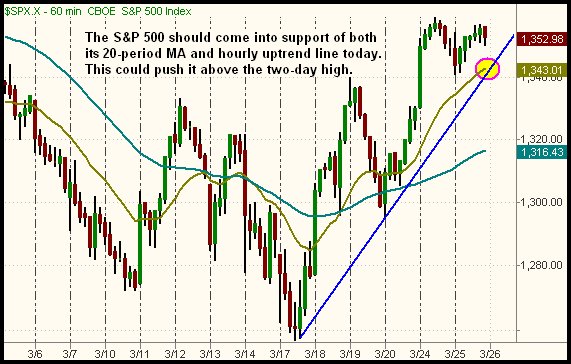
On the hourly chart of the S&P 500 below, notice the uptrend that has developed. It began with the low of March 17, and is anchored by the opening low of March 20:

Notice how the 20-period exponential moving average (the beige line) is about to converge with the hourly uptrend line (the ascending blue line). This commonly occurs in steady trends, and is the reason why the 20-EMA on the hourly chart often acts as support that enables a resumption of the trend. In downtrends, the 20-EMA conversely acts as resistance that drives stocks or indexes lower. Going into today, observe the price action of the S&P 500 as it tests support of the 20-EMA and hourly uptrend line. If these support levels push the S&P above its two-day high, we'll have confirmation that the broad market remains rather strong. But even if that fails to happen, the technical state of the broad market remains bullish, just as long as the S&P 500 holds support of yesterday's low. In the latter case, a new anchor point will be drawn to form a more gradual uptrend line off the March 17 low.
Our overall market bias remains the same. We're still bullish on the short-term, neutral to cautiously bullish on the intermediate-term, and bearish on the long-term. As always, this is not our opinion, but simply what the charts are telling us. Trade what you see, not what you think!
Open ETF positions:
Long - QLD, IYT, INP, DUG
Short - (none)
Deron Wagner is the Founder and Head Trader of both Morpheus Capital LP, a U.S. hedge fund, and Morpheus Trading Group, a trader education firm launched in 2001 that provides daily technical analysis of the leading ETFs and stocks. For a free trial to the full version of The Wagner Daily or to learn about Wagner's other services, visit MorpheusTrading.com or send an e-mail to deron@morpheustrading.com.
|