|
The Wagner Daily ETF Report for March 25
As anticipated, stocks followed through on the bullish momentum that began developing last week, enabling the major indices to score another round of solid gains. Led by a rare show of strength in the Semiconductor Index ($SOX), the Nasdaq Composite powered 3.0% higher. The S&P 500 and Dow Jones Industrial Average both climbed only half as much (1.5%). The small-cap Russell 2000 and S&P Midcap 400 indices rallied 2.9% and 2.3% respectively. Each of the main stock market indexes closed in the upper third of its intraday range.
Total volume in the NYSE receded a surprising 37%, while volume in the Nasdaq was 13% lighter than the previous day's level. Considering the extent of yesterday's gains, especially in the Nasdaq, it's a bit disappointing that turnover eased so much. In both exchanges, trading limped in below 50-day average levels. Still, remember that much of last Thursday's higher volume was likely attributed to "quadruple witching" options expiration day. Though the S&P and Nasdaq both registered bullish "accumulation days" by gaining on higher volume last Thursday, we'll need to see more such days of higher volume gains in order to confirm the intermediate-term bottom the stock market may be trying to put in. Regardless of yesterday's weak volume, market internals were quite bullish. In the Nasdaq, advancing volume trounced declining volume by a margin of 10 to 1. The NYSE ratio was positive by 4 to 1.
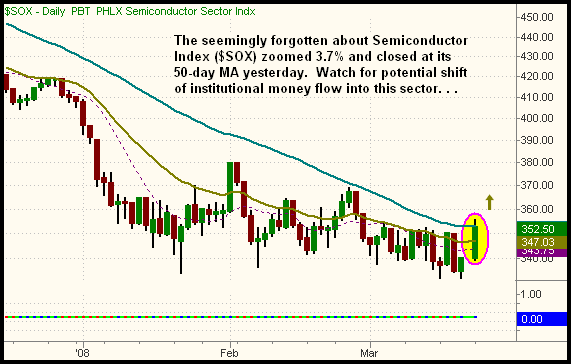
The seemingly forgotten about $SOX index took center stage yesterday. The index has been consolidating in a tight range, near its 52-week low, for the past several months. It has been rather stagnant, ignoring the direction of the broad market throughout its recent volatility. Yesterday, however, the $SOX came to life with a 3.7% gain. More importantly, it rallied to test resistance of its 50-day MA for the first time since last October. Today, if the $SOX finishes above yesterday's high, it will have confirmed a breakout above its 50-day MA:

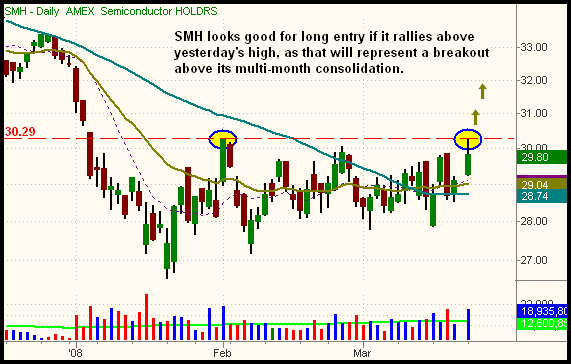
In the event the $SOX breaks out, we're stalking the Semiconductor HOLDR (SMH) for potential long entry. A move above yesterday's high would push SMH above resistance of its multi-month consolidation. Its daily chart is shown below:

Although SMH is still near its 52-week low, notice we are waiting for a reversal of momentum above its recent resistance before buying. This is very different than dangerous "bottom fishing," in which one merely guesses where the bottom is, and blindly buys without first having some proof momentum has reversed. Nevertheless, even if SMH breaks out above yesterday's high, we're only expecting upside as a counter-trend bounce in the short to intermediate-term. Expectations must be kept rather low when buying reversals of downtrends near the lows. Still, the risk/reward of such entries can often be quite favorable, as one can keep a tight stop while providing for considerable upside. Subscribers should note our detailed trigger, stop, and target prices for the SMH setup below.
In yesterday's commentary, we pointed out the potential breakouts in both the iShares Transportation (IYT) and iShares Taiwan Index (EWT). Both broke out above the resistance levels we highlighted, with EWT gapping sharply higher on news of its presidential election. Now that the breakouts have been confirmed, we'll be monitoring both ETFs for a pullback to support or bullish consolidation at the highs. These ETFs are in play on the long side, just as long as a low-risk entry point can be achieved. By the way, if trading IYT, you may want to keep an eye on the price of Crude Oil, as well as the various oil indexes. There tends to be an inverse relationship between the price of oil and the price of transportation stocks. We're not long IYT, but we remain short the oil sector, through the inversely correlated UltraShort Oil and Gas ProShares (DUG). Oil still looks lower, despite the newfound strength in the broad market.
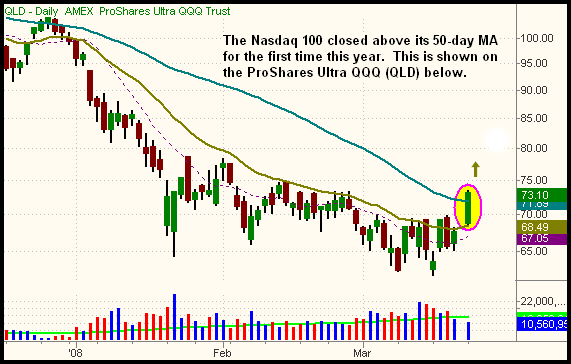
The sudden show of strength in the tech arena enabled the Nasdaq 100 Index to close above resistance of its 50-day MA for the first time this year. This is illustrated on the daily chart of the ProShares Ultra QQQ Trust (QLD) below. Thanks to yesterday's breakout, our QLD position is now showing an unrealized gain of more than 5 points since our March 18 entry:

Along with the Nasdaq 100, both the S&P 500 and Nasdaq Composite indexes also closed above their 50-day MAs for the first time this year. The Dow already did so last Thursday. Further, each of the major indices broke out above its intermediate-term downtrend line that had roughly converged with its 50-day MA. Assuming yesterday's move was not a "fakeout" that immediately fails today, this is a rather positive technical sign for the broad market. Obviously, the long-term downtrends remain intact, but the short and intermediate-term trends are turning up. As long as one remains cognizant of the fact we're still in a long-term broad market downtrend, there's nothing wrong with capitalizing on the bullishness while it lasts.
Open ETF positions:
Long - QLD, INP, DUG
Short - (none)
Deron Wagner is the Founder and Head Trader of both Morpheus Capital LP, a U.S. hedge fund, and Morpheus Trading Group, a trader education firm launched in 2001 that provides daily technical analysis of the leading ETFs and stocks. For a free trial to the full version of The Wagner Daily or to learn about Wagner's other services, visit MorpheusTrading.com or send an e-mail to deron@morpheustrading.com.
|