| The Wagner Daily ETF Report for March 14 |
| By Deron Wagner |
Published
03/14/2008
|
Stocks
|
Unrated
|
|
|
|
The Wagner Daily ETF Report for March 14
Stocks got off to an ugly start yesterday morning, but the bulls took advantage of the early weakness, enabling the broad market to close significantly higher. The major indices opened near Tuesday's lows, briefly dipped to new intraday lows ninety minutes later, then began trending higher at mid-day. The Nasdaq Composite gained 0.9%, erasing the previous day's retracement and then some. The S&P 500 and Dow Jones Industrial Average climbed 0.5% and 0.3% respectively. Small and mid-cap stocks resumed their recent show of relative strength. The Russell 2000 advanced 1.9% and the S&P Midcap 400 rallied 1.3%. The main stock market indexes finished near their intraday highs.
Higher turnover across the board helped confirm the validity of yesterday's gains. Total volume in the NYSE rushed 18% higher, while volume in the Nasdaq increased 16% above the previous day's level. Trading moved back above average levels, and both exchanges scored their second bullish "accumulation days" this week. Yesterday's and Tuesday's higher volume gains showed an institutional demand for stocks, while Wednesday's lighter volume pullback was also positive. For the current rally attempt to become sustainable, "up" days should be on higher volume, while "down" days should be on lighter volume. The stock market's volume patterns have turned bullish for the first time in quite a while.
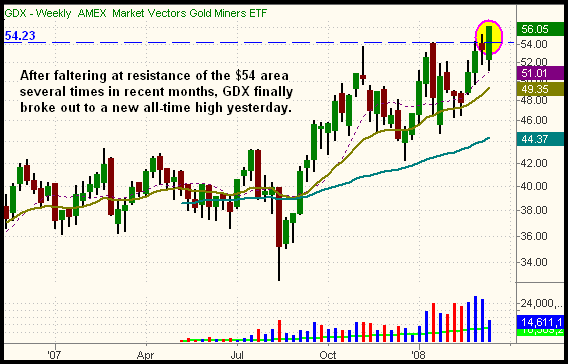
As you may have heard, spot gold touched the $1,000 per ounce mark yesterday. The StreetTRACKS Gold Trust (GLD) obviously gapped to a new high as well. Occasionally, the price of spot gold and the gold mining stocks move in sync with one another. Most of the time, one leads and the other lags. Yesterday's pop in spot gold finally enabled the Market Vectors Gold Trust (GDX), composed of a basket of gold mining stocks, to gap up above major resistance and close at a new high. The breakout is shown on the weekly chart below:

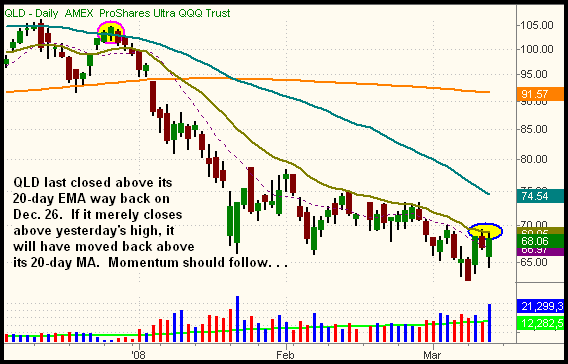
In yesterday's commentary, we discussed the possibility of buying the opening gap down, as long as the S&P 500 opened at or above its 61.8% Fibonacci retracement from the March 10 low to March 12 high. Its gap was pretty steep, so it opened below the 61.8% retracement level of 1,295. However, the Nasdaq, which rallied more than the S&P 500 on March 11 and pulled back less on March 12, opened above its 61.8% retracement. As such, we bought a half position of the ProShares Ultra QQQ (QLD) on the open, then added to the position after it rallied above its high of the first 20 minutes just before noon. So far, the trade is already showing an unrealized gain of 2.2 points. Given the Nasdaq's resilience yesterday, along with the positive volume patterns stocks have begun exhibiting, odds favor at least near-term follow-through on the rally that began Tuesday. Looking at the daily chart of QLD, it appears poised to rip through its 20-day EMA within the next few days:

Notice that way back on December 26 (circled in pink) was the last time QLD closed above its 20-day EMA. It only did so for one day before falling back down again. This shows us just how well the 20-day EMA acts as resistance in strongly downtrending markets. Of course, it also acts perfectly as support in strong uptrends. Because the 20-day EMA is such a pivotal level of resistance, QLD should surge higher if it simply closes above yesterday's high. It will be the first time it has done so in nearly three months. Such a move should result in substantial bullish momentum in the short to intermediate-term. At the least, we would expect a test of the 50-day MA to happen quickly. Having a low-risk entry point near yesterday's low, we're ready to capitalize on such a move in the Nasdaq. Our protective stop is currently just below the March 11 low, but we will trail it higher as soon as QLD (and the Nasdaq 100) breaks out above its 20-day EMA. On the long side, the Nasdaq and its related sectors look better than the S&P and Dow right now.
Open ETF positions:
Long - QLD, FXI
Short - (none)
Deron Wagner is the Founder and Head Trader of both Morpheus Capital LP, a U.S. hedge fund, and Morpheus Trading Group, a trader education firm launched in 2001 that provides daily technical analysis of the leading ETFs and stocks. For a free trial to the full version of The Wagner Daily or to learn about Wagner's other services, visit MorpheusTrading.com or send an e-mail to deron@morpheustrading.com.
|