|
The Wagner Daily ETF Report for March 13
Bullish momentum from Tuesday's rally spilled into yesterday morning's session, but traders sold into strength in the afternoon, causing stocks to finish lower. The S&P 500 reversed its 1.0% intraday gain into a closing loss of 0.9%. The Dow Jones Industrial Average and Nasdaq Composite followed similar intraday patterns, finishing lower by 0.4% and 0.5% respectively. The small-cap Russell 2000 fell 1.0%, but also gained the most on Tuesday. The S&P Midcap 400 dipped 0.5%. Opposite of the previous day, the main stock market indexes settled at their intraday lows.
Turnover eased significantly in both exchanges, telling us that institutional traders stepped aside yesterday. Total volume in the NYSE receded 16%, while volume in the Nasdaq decreased 13% below the prior day's level. Curiously, it was one of the lightest volume days in weeks. Market internals were negative, but not by a wide margin. In the NYSE, declining volume exceeded advancing volume by approximately 2 to 1. The Nasdaq adv/dec volume ratio was negative by just 3 to 2.
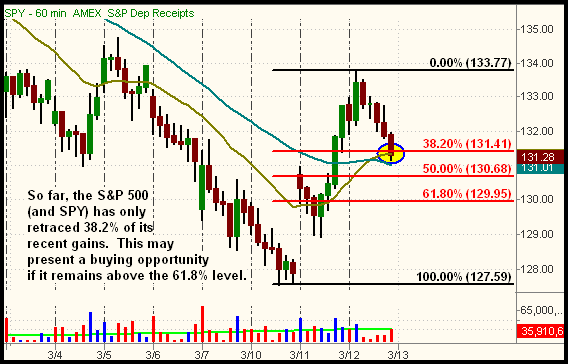
In yesterday morning's Wagner Daily, we said we wanted to observe the day's follow-up action before initiating new positions. Given the extent of Tuesday's gains, yesterday's pullback was not that bad. We know this through the use of the Fibonacci retracement indicator. Even though we recently used Fibonacci to find the next major support area on the long-term monthly chart of the S&P 500, the indicator is equally effective at predicting support levels in very short-term timeframes. To illustrate this, take a look at the hourly chart of the benchmark S&P 500 SPDR (SPY):

When a downtrending market rallies very rapidly, we can predict the likelihood of the reversal remaining intact, based on the depth of the subsequent retracement. There are more Fibonacci retracement levels than what we've shown on the chart above, but the most significant levels are 38.2%, 50%, and 61.8%. The deeper the retracement of an uptrending stock, ETF, or index, the less strength it is showing. In steady and solid trends, retracements will rarely exceed the 38.2% level. A retracement to the 50% level is what I call the "danger zone," as momentum can subsequently reverse quite rapidly. However, the odds still slightly favor a move back to the high. The 61.8% level is typically the last major line of defense. When a retracement exceeds 61.8%, the index or stock will drop all the way down to the prior low a majority of the time.
Armed with this basic knowledge of Fibonacci retracements, notice that SPY (and the S&P 500) closed just below its 38.2% retracement from the March 10 low to the March 12 high. The 20-period exponential moving average (the beige line) is also providing support at the same price. Interestingly, the 20-period EMA and 38.2% Fibonacci retracements commonly converge to provide support. If the S&P 500 holds yesterday's low, the brief pullback may therefore be a low-risk buying opportunity to trade the counter-trend bounce that started on Tuesday. However, as of early this morning, the S&P futures are already off by more than 1%. If the situation fails to improve before the open, the S&P 500 will open just below its 61.8% retracement level (the 1,295 area), as will several of the other broad-based indexes. By the way, if you check the daily chart of the S&P 500 (and SPY), you'll see that yesterday's high coincided with resistance of the 20-day EMA we recently pointed out.
If the S&P 500 opens at 1,295 or higher today, we view the gap down as a low-risk entry point to buy the broad-based ETFs. However, all bets are off on the long side of the market if the index opens below or falls below that level. If that occurs, the odds would be too great that momentum would completely reverse and send stocks back to their lows. To minimize risk when buying gap downs, the MTG Opening Gap Rules work well. Simply wait for a new high after the first 20 minutes of trading before buying. This increases the likelihood of an uptrend becoming established intraday. If the new 20-minute high never comes, just pass on the entry.
Given the pre-market gap down in the S&P and Nasdaq futures, it is paying off that we utilized patience and discipline to "wait and see," rather than buying at the first sign of Tuesday's strength. If the broad market gaps down and subsequently sets a new high after the first 20 minutes, we'll probably enter one or two new long positions via real-time Intraday Trade Alert to subscribers. Because we're in a bear market, this is a much safer way to enter new long positions. Since the Nasdaq is showing slight relative strength to the S&P and Dow, we would probably buy the ProShares Ultra QQQ (QLD). But if the market gaps lower today and fails to recover, we'll continue to observe from the sidelines in Zen-like fashion. Capital preservation should always be your primary goal in a bear market.
Open ETF positions:
Long - (none)
Short - (none)
Deron Wagner is the Founder and Head Trader of both Morpheus Capital LP, a U.S. hedge fund, and Morpheus Trading Group, a trader education firm launched in 2001 that provides daily technical analysis of the leading ETFs and stocks. For a free trial to the full version of The Wagner Daily or to learn about Wagner's other services, visit MorpheusTrading.com or send an e-mail to deron@morpheustrading.com.
|