| The Wagner Daily ETF Report for February 20 |
| By Deron Wagner |
Published
02/20/2008
|
Stocks
|
Unrated
|
|
|
|
The Wagner Daily ETF Report for February 20
Stocks kicked off the holiday-shortened week with a fair amount of enthusiasm on yesterday's open, but it faded fast. Although the major indices gapped more than 1% higher out of the starting gate, the bears were not impressed. By mid-day, the broad market had given back most of its opening gain. Following a few hours of choppy action in the early afternoon, sellers resumed control into the close. Both the S&P 500 and Dow Jones Industrial Average finished 0.1% lower, while the Nasdaq Composite lost 0.7%. The small-cap Russell 2000 and S&P Midcap 400 indices each eked out a gain of 0.1%. All the main stock market indexes closed in the bottom quarter of their intraday ranges.
Total volume in both the NYSE and Nasdaq came in 3% lighter than the previous day's level. Turnover across the board remained below 50-day average levels. Trading in the Nasdaq was actually the second lightest day of the year. Institutional participation has clearly been lacking in recent weeks. Traders and investors are likely waiting to see the market's next move as it remains stuck between short-term support and resistance levels. Yesterday, we pointed out the "wedge" pattern that the S&P 500 has been forming. Declining volume during the formation of this pattern is normal. Volume will typically surge higher only after the index makes a clean break in either direction, above the upper channel or below the lower channel.
In yesterday's commentary, we said of the "wedge" patterns that were forming on many daily charts that, "Stocks have been in a primary downtrend since October of 2007, so the odds favor a resolution to the downside and a test of the January lows in the near future. Nevertheless, don't be surprised if the S&P 500 spikes above the upper channel of its "wedge" for a few days, squeezes all the shorts, then fails the upside breakout." Though it hasn't been a few days, the index did indeed probe above the upper channel resistance of its "wedge" pattern on yesterday's open. Not surprisingly, the gap up failed to hold, sending the S&P back down to test the lower boundary of the pattern. Failed upside opening gaps commonly fail in bear markets because traders use the move as an excuse to sell into strength. This failed breakout is illustrated on the daily chart below:

Let's take an updated look at our three open positions going into yesterday morning: long UltraShort Financials ProShares (SKF), long UltraShort S&P 500 ProShares (SDS), and long U.S. Natural Gas Fund (UNG).
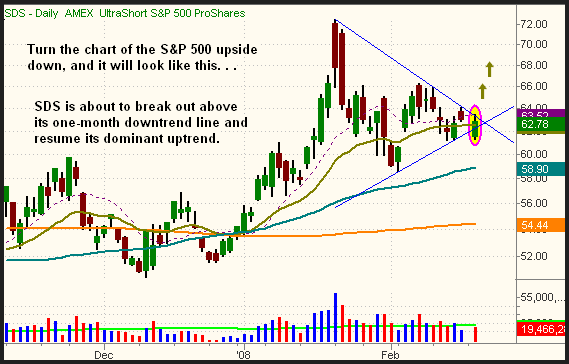
The broad market's opening strength caused both SKF and SDS to near the proximity of our protective stops, but they didn't get hit. Because SDS moves in the inverse direction of the S&P 500, the inability of the S&P to rally above resistance of last week's high means that SDS held support of last week's low. Since our stop is about 50 cents below support of the February 13 "swing low," we avoided getting stopped out on the open. SDS is now poised to break out above its one-month downtrend line and resume its long-term uptrend. The S&P 500 is, of course, in danger of doing the opposite. If you turn the chart of the S&P 500 upside down, it will look much like this chart of SDS:

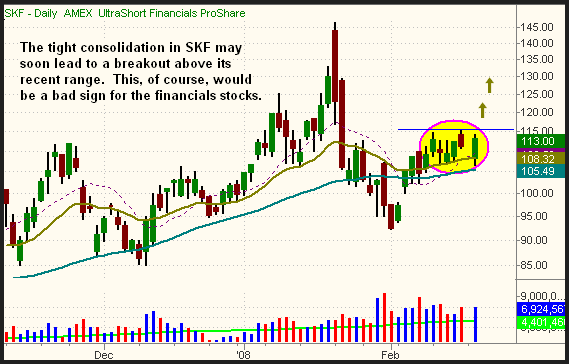
Like SDS, the inversely correlated SKF also tested and held support of last week's lows on the open. After reversing and rallying throughout the day, it closed near the top of its recent consolidation. With support of the 20-day EMA holding firmly below, SKF is poised to breakout above its tight base of consolidation and zoom back to the area of its prior highs. Based on the bullish chart pattern of SKF, one could conclude the financial stocks are about to get hit again. We're ready to profit if that happens, as we already have an unrealized gain of nearly two points in SKF:

Finally, the U.S. Natural Gas Fund (UNG) rallied to a new multi-month high yesterday, continuing the bullish momentum that began last week. This shows the benefit of finding ETFs with a low correlation to the overall stock market. Commodity, currency, and fixed-income ETFs are all great for that. Below is the daily chart of UNG:

UNG is now very near our original price target of $44.40, which was derived from a test of the November 1 highs. To protect our gain in the event of it stalling out before reaching the target price, we have trailed our UNG stop tighter. It is now just below yesterday's low.
Overall, odds still favor the major indices testing major support of their January lows in the near future. But remember that the "smart money" likes to first run the short sellers out of their positions on opening gap ups. Trading on the short side in a bear market can be trickier than buying stocks in a bull market because reversals can be fast and furious, albeit short-lived. To help overcome the situation, consider reducing share size and widening your stops to afford more "wiggle room" above or below the areas of resistance and support. That will reduce the odds of getting "chopped up," while keeping your level of risk consistent.
Open ETF positions:
Long - UNG, SKF, SDS
Short - (none)
Deron Wagner is the Founder and Head Trader of both Morpheus Capital LP, a U.S. hedge fund, and Morpheus Trading Group, a trader education firm launched in 2001 that provides daily technical analysis of the leading ETFs and stocks. For a free trial to the full version of The Wagner Daily or to learn about Wagner's other services, visit MorpheusTrading.com or send an e-mail to deron@morpheustrading.com.
|