| The Wagner Daily ETF Report for February 13 |
| By Deron Wagner |
Published
02/13/2008
|
Stocks
|
Unrated
|
|
|
|
The Wagner Daily ETF Report for February 13
The major indices broke out above the highs of their recent trading ranges yesterday, but the move failed to generate the strong momentum one might have expected. Although stocks trended steadily higher throughout the morning, a bearish afternoon reversal undid much of the bulls' efforts. Relative weakness in the tech arena caused the Nasdaq Composite to finish unchanged. Blue chips led the Dow Jones Industrial Average to a 1.1% gain, while the S&P 500 trailed behind with a 0.7% advance. The small-cap Russell 2000 and S&P Midcap 400 climbed 0.8% and 0.2% respectively. Despite the broad market closing mostly higher, intraday price action was rather bearish. With the exception of the Dow, all the main stock market indexes finished in the bottom half of their intraday ranges.
Turnover in the NYSE rose 12% above the previous day's level, while total volume in the Nasdaq increased 6% above the previous day's level. Regardless of the S&P and Dow rallying on higher volume, the weak afternoon price action makes us hesitant to declare yesterday a bullish "accumulation day." Further, the Nasdaq just spun its wheels. Advancing volume in the NYSE exceeded declining volume by less than 2 to 1. The Nasdaq adv/dec volume ratio was actually slightly negative.
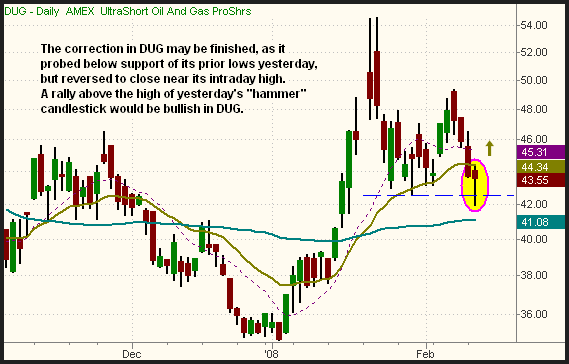
After a near-term bounce in oil, we are now seeing bearish chart patterns on the daily charts of many leading oil stocks. The correction in the inversely correlated UltraShort Oil and Gas ProShares (DUG), an energy ETF we regularly trade, appears to have run its course. It dipped below support of its prior lows yesterday morning, but rallied to close above the lows in the afternoon. This is illustrated on the daily chart of DUG below:

DUG formed a bullish "hammer" candlestick pattern yesterday. If it rallies above the high of that candle in today's session, it will coincide with a rally back above its 20-day EMA. At that point, we will consider buying DUG. Our initial price target would be a test of the prior highs from late January. A protective stop would be placed below yesterday's low.
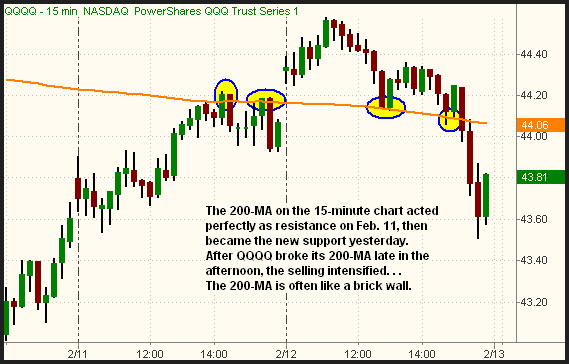
Recently, we discussed the importance of monitoring the 200-day moving average as an indicator of long-term support and resistance on various indexes. Though the daily time frame is the one most casual chartists follow, we know that the 200-period moving average just as accurately acts as support and resistance on shorter-term intraday charts. The 15-minute intraday chart of the popular Nasdaq 100 Index Tracking Stock (QQQQ) over the past two days is a good example of this. On the chart below, we have removed the other moving averages so that you can more easily see the 200-MA:

On February 11, notice how the 200-MA acted as overhead resistance that prevented QQQQ from moving higher. Then, after it gapped open above that level of resistance, it became the new support in yesterday's session. At mid-day, and several times thereafter in the afternoon, QQQQ bounced off the 200-MA before eventually plunging below it during the final hour of trading. Notice how quickly QQQQ dropped after finally breaking its 200-MA. When analyzing intraday charts, remember this example because it happens time and time again. Rarely will an index, stock, or ETF slice through its 200-day MA, on any major time frame, without first bouncing off it a few times. More importantly, the most basic tenet of technical analysis is that a prior level of support becomes the new resistance after the support is broken (and vice versa).
In yesterday's commentary, we pointed out the potential short entry in the CurrencyShares Euro Trust (FXE). It gapped up in the morning, but closed at its intraday low. The feeble rally attempt into resistance of its 50-day MA therefore provided an even better risk/reward ratio for short entry. If you attempted to sell short FXE and had trouble borrowing shares from your broker, we just discovered a good alternative through buying the PowerShares U.S. Dollar Index (UUP). Whereas FXE follows the price of the euro to the dollar, UUP follows the price of the dollar to the euro. Just a heads-up for those of you who were interested in that trade idea.
Because bullish momentum was significantly lacking during yesterday's breakout above the recent trading ranges, we feel there is a very strong possibility the major indices will succumb to the pressure of the current bear market and slide to new lows in the coming days. Specifically, all bets are off on the long side of the market if the major indices fall below yesterday's lows. Such price action would trap the bulls who bought yesterday morning's breakout, forcing them to sell. A snowball effect could follow as short sellers subsequently join the party. If you're long anything with direct market correlation, consider using tight stops right now. We'll also be looking for new potential short entries in the broad market if yesterday's lows are broken.
Open ETF positions:
Long - DBC, UNG
Short - (none)
Deron Wagner is the Founder and Head Trader of both Morpheus Capital LP, a U.S. hedge fund, and Morpheus Trading Group, a trader education firm launched in 2001 that provides daily technical analysis of the leading ETFs and stocks. For a free trial to the full version of The Wagner Daily or to learn about Wagner's other services, visit MorpheusTrading.com or send an e-mail to deron@morpheustrading.com.
|