|
The Wagner Daily ETF Report for January 8
Showing indifference to last week's pummeling, the major indices started the week little changed. After undulating in a rather wide range throughout the day, the S&P 500 settled 0.3% higher. The Dow Jones Industrial Average similarly gained 0.2%, but relative weakness in leading tech stocks caused the Nasdaq to slip another 0.2%. The small-cap Russell 2000 advanced 0.3%, as the S&P Midcap 400 lost 0.3%. All of the main stock market indexes finished near the middle of their intraday ranges, indicating a bit of indecision into the close.
As volatility picked up, total volume in both the NYSE and Nasdaq edged 2% above the previous day's levels. With stocks whipping around on both sides of the flat line and closing mixed, the slightly higher volume didn't tell us much. In the NYSE, advancing volume was basically on par with declining volume. Declining volume in the Nasdaq exceeded advancing volume by a ratio of 2 to 1.
On the surface, yesterday's session may appear uneventful. However, a closer look shows major distribution was taking place amongst leading stocks. Apple (AAPL), Google (GOOG), Priceline.com (PCLN), Baidu.com (BIDU), SunPower (SPWR), and Intuitive Surgical (ISRG) are just a few of the leading growth stocks that moved firmly below their 50-day moving averages on increasing volume yesterday. There were many more. Most financial news outlets focus primarily on the price action of the S&P, Nasdaq, and Dow, but the reality is that these broad-based indexes usually follow the price action of leading growth stocks, not the other way around.
When companies with the strongest records of earnings growth are showing major weakness, one cannot expect the rest of the broad market to show substantial strength. Sure, there were pockets of buying interest yesterday, but primarily within "defensive" sectors that institutional investors seek out when the market is on shaky ground. Traditional sectors such as Utilities, Healthcare, and Pharmaceuticals all posted sharp gains yesterday. Of these, the DJ Utilities Average ($DJU) has the most bullish chart pattern. Below is a daily chart of the Utilities HOLDR (UTH), which closely follows the $DJU index:
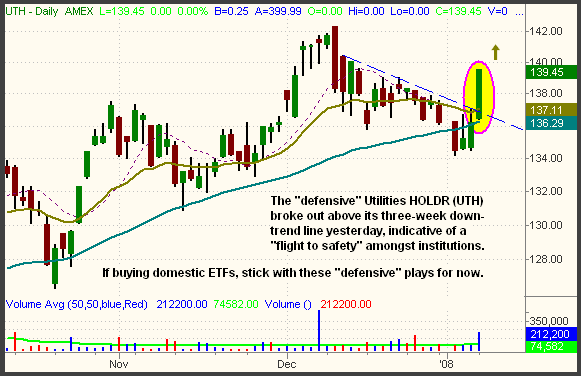
UTH dipped below its 50-day MA for a couple days, washing out the "weak hands," but snapped back to a 2.4% gain yesterday. Notice how the recovery above the 50-day MA coincided with a breakout above its three-week downtrend line as well. Institutional buying helped UTH to print nearly three times its average daily volume. Because a vast majority of stocks follow the trend of the broad market, we must say that buying new stocks and ETFs right now is a risky proposition. Nevertheless, defensive ETFs such as UTH may present the lowest risk if you feel some overwhelming need to presently be in the market. The leveraged ProShares Ultra Utilities ETF (UPW) provides more "bang for the buck" than UTH, but its low average daily volume may lead to wider spreads.
The international stock market ETFs tend to follow the direction of the U.S. markets, but the iPath India Index (INP) continues to show impressive relative strength to our domestic markets. While last Friday's sell-off caused the major indexes to either test or break below their prior lows from November, INP merely bounced off support of its 50-day MA, which was well above its prior low. Continuing to set a series of "higher highs" and "higher lows," INP remains in a steady primary uptrend. Now, it is poised to break out above resistance of its one-month downtrend line from the December high. The descending blue dashed line on the daily chart below illustrates this:
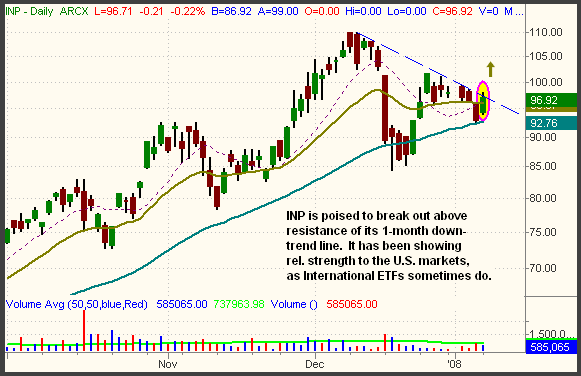
If "defensive" sectors such as Utilities provide a low-risk safe haven for institutional investors, international ETFs provide another option for investments that are not directly correlated to the direction of the S&P, Nasdaq, and Dow. As long as proper stop losses are adhered to, investing in emerging market ETFs such as INP is only slightly riskier than investing in "defensive" domestic ETFs such as UTH. The profit potential is also much greater. In the case of INP, a rally above yesterday's high constitutes a valid long entry we will consider. Still, share size will be reduced would be on this and any other long positions entered this week.
We still plan to initiate short positions on the weakest broad-based ETFs when they bounce into key resistance levels, but that hasn't happened yet. If stocks see a relief rally in the coming days, we'll analyze the best setups on the short side. Until then, laying low is a good idea.
Open ETF positions:
Long - (none)
Short - (none)
Deron Wagner is the Founder and Head Trader of both Morpheus Capital LP, a U.S. hedge fund, and Morpheus Trading Group, a trader education firm launched in 2001 that provides daily technical analysis of the leading ETFs and stocks. For a free trial to the full version of The Wagner Daily or to learn about Wagner's other services, visit MorpheusTrading.com or send an e-mail to deron@morpheustrading.com.
|


 Free Festival of Traders Videos