| The Wagner Daily ETF Report for December 4 |
| By Deron Wagner |
Published
12/4/2007
|
Stocks
|
Unrated
|
|
|
|
The Wagner Daily ETF Report for December 4
After gapping lower on the open, the broad market recovered into slightly positive territory by mid-day, but the bears sent stocks lower in the afternoon. The Nasdaq Composite fell 0.9%, the S&P 500 lost 0.6%, and the Dow Jones Industrial Average declined 0.4%. The small-cap Russell 2000 shed 1.0%, as the S&P Midcap 400 dipped 0.4%. Like the previous day, all the major indices settled near their intraday lows.
Although the Nasdaq Composite declined for the second straight day, it was positive that it did so on lighter turnover this time. Enabling the Nasdaq to dodge what would have been another "distribution day," total volume in the exchange eased 20%. Volume in the NYSE similarly dropped 31% below the previous day's level. In both exchanges, trading limped in below 50-day average levels, indicating an overall lack of commitment among institutional traders. Market internals were negative, but not by a wide margin. In both the NYSE and Nasdaq, declining volume exceeded advancing volume by a ratio of 2 to 1.
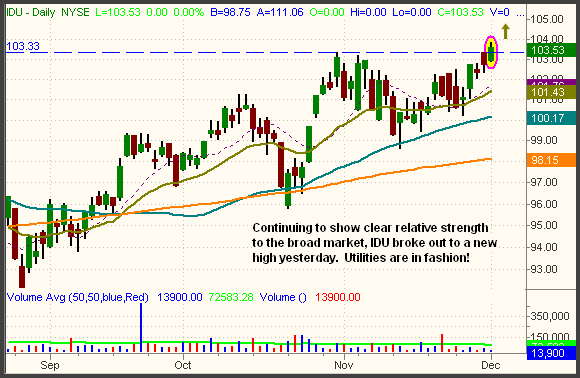
Gaining 1.0% while the major indices each posted losses, the DJ Utilities Average ($DJU) closed at a fresh all-time high yesterday. Showing relative strength by barely moving lower with the broad market last month, the $DJU was the first industry sector to break out to a new high as the stock market began bouncing off its lows. Mirroring the price action in the $DJU index, the iShares DJ Utilities Index (IDU) also cruised higher yesterday. As mentioned last week, the Utilities ETFs are slow movers, but they also tend to show great resilience during periods of market turmoil. Their regular dividend distributions are an added bonus. The daily chart below shows yesterday's breakout in IDU:

When ETFs are trading at new highs, we don't use specific price targets because the lack of overhead resistance often enables them to go much higher than one might expect. Therefore, we are utilizing a trailing stop strategy so that we can maximize our gains, while protecting profits along the way. Our IDU position is currently showing an unrealized gain of 2.4 points since our long entry on November 19.
The biggest question on many traders' minds right now is the projected longevity of the recent bounce off the November lows. Contributing to the bullish argument are several factors: leading growth stocks have begun outperforming the major averages again, the Nasdaq and Dow are back above their 200-day MAs, optimism towards the December 11 Federal Reserve Board meeting, and bullish seasonality. The bears may argue that: the benchmark S&P 500 remains stuck below its 200-day MA, both the Nasdaq and Dow are below their 50-day MAs (which often determines the overall bias of institutional trading activity), weekly charts are showing many breaks of long-term uptrends and bearish trend reversals, and fear of more "timebombs" out of the financial sector. For now, we can only know what the charts tell us; most of the major indices are putting in short-term bounces within the context of their intermediate-term downtrends. Long-term trends are now mixed.
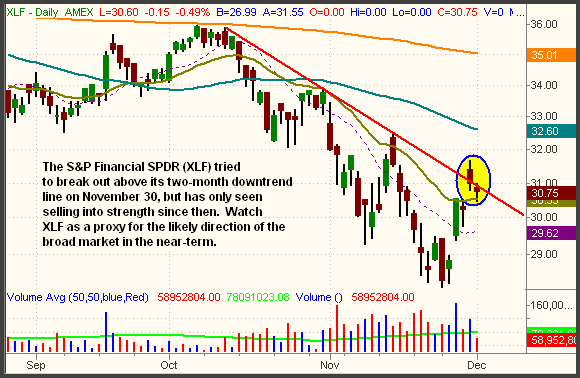
Perhaps one of the best ways of knowing the market's next move is to keep a close eye on the performance of the Financial sectors. The price action of Banks, Securities Broker-Dealers, and other sub-sectors that had exposure to the sub-prime mess will have a big bearing on whether or not the current rally develops legs. As a proxy for all the financials, consider monitoring the daily price action in the S&P Financial SPDR (XLF). As the daily chart below illustrates, XLF is stuck at resistance of its sharp, two-month downtrend line:

If XLF manages to close above its November 30 high, it would indicate a break of its intermediate-term downtrend. Though a lot of overhead supply would still remain, such a bullish move could lead to further upside momentum in financials. Obviously, this would be positive for the overall broad market. However, based on its weak closing prices of the past two days, it appears that XLF (and the financials in general) has only seen selling into strength of the recent bounce.
Open ETF positions:
Long - IDU
Short - (none)
Deron Wagner is the Founder and Head Trader of both Morpheus Capital LP, a U.S. hedge fund, and Morpheus Trading Group, a trader education firm launched in 2001 that provides daily technical analysis of the leading ETFs and stocks. For a free trial to the full version of The Wagner Daily or to learn about Wagner's other services, visit MorpheusTrading.com or send an e-mail to deron@morpheustrading.com.
|