| The Wagner Daily ETF Report for November 20 |
| By Deron Wagner |
Published
11/20/2007
|
Stocks
|
Unrated
|
|
|
|
The Wagner Daily ETF Report for November 20
The main stock market indexes kicked off the holiday-shortened week on a negative note, as stocks fell sharply across the board. After gapping lower on the open, the broad market sank steadily through mid-day. With two hours remaining, buyers attempted to reverse the downward slide, but the bears resumed control in the final hour of trading. The S&P 500 fell 1.8%, while both the Nasdaq Composite and Dow Jones Industrial Average tumbled 1.7%. Small caps felt the most pain, as the Russell 2000 Index plunged 2.5%. The S&P Midcap 400 lost 1.9%. Each of the major indices closed near their intraday lows, but held above their worst levels from earlier in the afternoon.
Total volume in the NYSE was on part with the previous day's level. Nasdaq turnover declined 14%. Again, one could expect trading activity to continue tapering off ahead of Thursday's Thanksgiving Day holiday. Although volume was lighter, market internals were rather ugly. Declining volume in the NYSE blew away advancing volume by a margin of 9 to 1. The Nasdaq ratio was negative by just over 5 to 1. The unpropitious internals confirmed the broad-based nature of yesterday's selling. Of the major industry sectors we follow daily, only the DJ Utilities Average ($DJU) closed positive, barely triggering our long entry in the iShares DJ Utilities Sector (IDU) setup that we discussed yesterday. We also closed our DUG long and XME short positions, locking in decent gains in both.
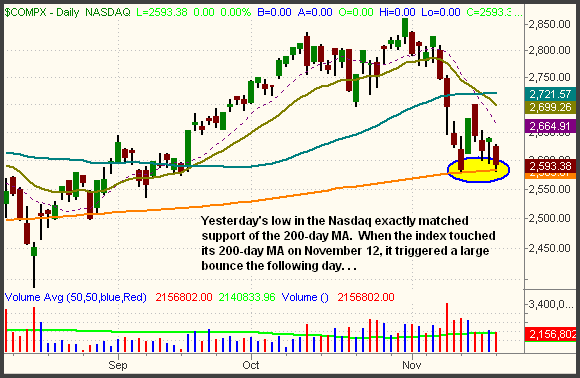
Yesterday's sell-off caused the Nasdaq Composite to close at support of its 200-day moving average for the second time in a week. When it last did so, on November 12, the index rallied 3.4% the following day. Given the overhead supply from the Nasdaq's inability to sustain its November 13 gain, it's unlikely we see a bullish reaction of the same magnitude in today's session. Nevertheless, the 200-day MA could easily trigger another bounce of a lesser degree. The mild buying interest we saw yesterday afternoon occurred after the Nasdaq touched its 200-day MA just after mid-day. On the daily chart below, notice how yesterday's low in the Nasdaq Composite perfectly correlated to support of the 200-day MA (at the 2,583 level):

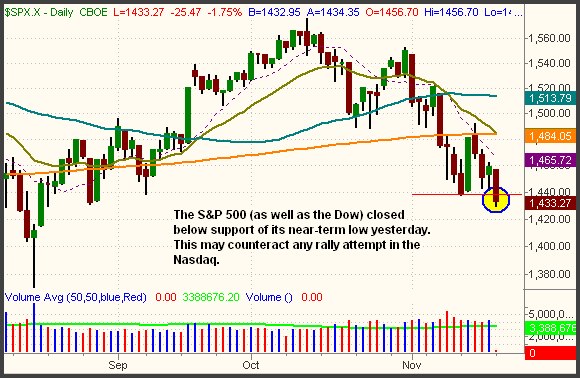
Countering the Nasdaq's support of the 200-day MA is the fact that the S&P 500 closed below support of its near-term low from November 12. A mere intraday "stop hunt" below the prior low would have been expected, but it's bearish that the index actually closed below the prior short-term low. Clearly, one could expect the current technical state of the S&P 500 to weigh on any rally attempt in the Nasdaq. The Dow Industrials also closed below its near-term low, but only marginally. The break of the prior low is illustrated on the daily chart of the S&P 500 below:

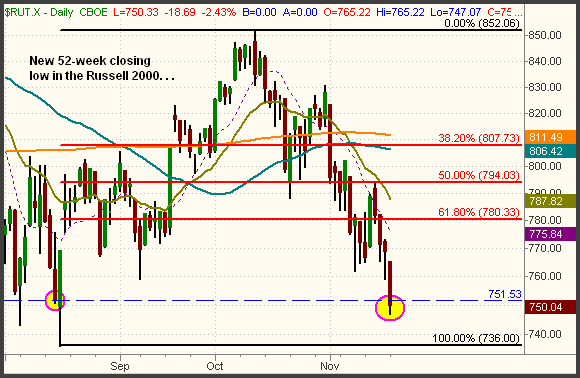
In the "big picture," it's now looking quite likely that both the S&P and Dow will test key support of their major lows from August. Both indexes have retraced more than two-thirds of the gains from their August lows to the October highs, lending very high odds they will fall all the way back down. Retracing just over half of its August to October gain, the Nasdaq Composite has a small chance of being the one saving grace. However, the small-cap Russell 2000 already set a new 52-week closing low yesterday, and is barely holding above its intraday lows from August. The Russell 2000 has also followed through to its projected downside target from the bearish "head and shoulders" chart pattern we pointed out in late October. The daily chart below shows the break-down to a new 52-week closing low, as well as the deep Fibonacci retracement the index has made:

Although the S&P and Dow are likely to test their August lows in the not-so-distant future, it does not mean they won't suddenly surge higher before doing so. Remember that both indexes ripped approximately 3% off their lows on November 13, but the gains had completely evaporated just four days later. A similar bounce scenario could play out within the next couple days, as the markets often see a bit of strength in holiday-shortened weeks. But if the anticipated bounce does not come, panic selling could easily send the major indices to test their August lows rather quickly. As always, be sure to maintain discipline to follow your protective stops, and only trade what you see, not what you think!
NOTE: The U.S. markets will be closed on Thursday, November 22 for the Thanksgiving Day holiday, and will close at 1:00 pm ET on Friday. As such, The Wagner Daily will not be published on Thursday, but regular publication will resume with a brief edition on Friday. Enjoy the holiday with your family and friends!
Open ETF positions:
Long - IDU
Short - (none)
Deron Wagner is the Founder and Head Trader of both Morpheus Capital LP, a U.S. hedge fund, and Morpheus Trading Group, a trader education firm launched in 2001 that provides daily technical analysis of the leading ETFs and stocks. For a free trial to the full version of The Wagner Daily or to learn about Wagner's other services, visit MorpheusTrading.com or send an e-mail to deron@morpheustrading.com.
|