| The Wagner Daily ETF Report for November 15 |
| By Deron Wagner |
Published
11/15/2007
|
Stocks
|
Unrated
|
|
|
|
The Wagner Daily ETF Report for November 15
Bullish momentum from the previous day's rally carried over into yesterday morning's session, but the enthusiasm faded later in the day. Stocks gapped higher on the open and oscillated in a sideways range the day, but the pattern of weak closing prices returned, sending stocks lower in the final thirty minutes of trading. The Nasdaq Composite reversed its opening gain of 1.0% to finish 1.1% lower. The S&P 500 similarly saw its 0.7% intraday gain transform into a 0.7% loss by the closing bell. The Dow Jones Industrial Average declined 0.6%, the small-cap Russell 2000 fell 0.9%, and the S&P Midcap 400 receded 0.5%. All the major indices settled in the bottom 20% of their intraday ranges.
Total volume in the NYSE eased 4%, while volume in the Nasdaq registered 10% lighter than the previous day's level. In both exchanges, trading backed off to its lowest level in weeks. Turnover was running higher in the morning, but gradually waned throughout the afternoon. Declining volume in the Nasdaq exceeded advancing volume by a margin of 2 to 1. The NYSE ratio was only slightly negative.
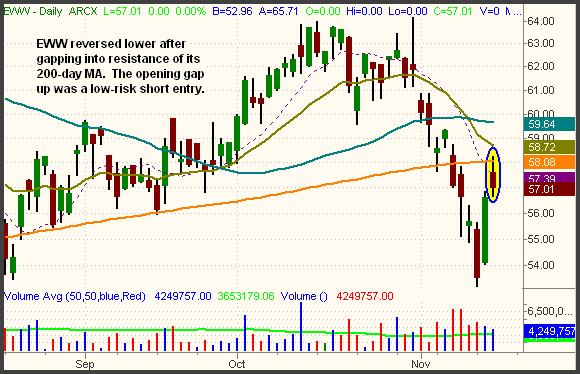
We covered our short position in the Mexico Index (EWW) for a large gain just three days ago, but re-entered it yesterday when EWW gapped into resistance of its 200-day MA. Selling short on the open, we were filled near the high of the day. EWW sold off later in the afternoon, enabling the position to already show a gain of approximately 1 point. By covering the short position into weakness three days ago, then waiting for a solid bounce into key resistance, we were essentially able to maintain our original short position, but with several points of profit already locked in. The daily chart of EWW below illustrates the gap up into resistance of the 200-day MA, an ideal entry for short positions:

In yesterday's Wagner Daily, we said of the S&P 500 that "not only will the 200-day MA now provide resistance, but the prior lows of October will as well." As anticipated, that's exactly what happened. The S&P opened right at its 200-day MA, probed above it twice throughout the morning, but eventually sold off to close firmly below that level. This is shown on the daily chart below:

Going into today's session, the area between the 200-day MA and yesterday's high will be a pivotal level of resistance to watch. If the S&P manages to close above yesterday's high, we could expect bullish momentum to carry the market a bit higher in the short-term. But considering that the S&P already retraced a third of Tuesday's big gain, a close below yesterday's low could cause the index to quickly retest its recent low. Note that the closing price is more important than just intraday spikes ("stop hunts") outside of yesterday's range.
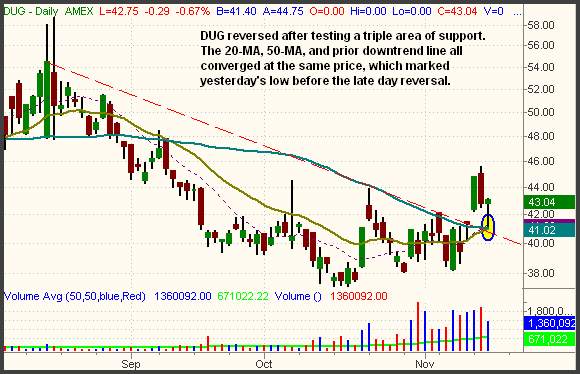
When discussing resistance of the 200-day moving average in yesterday's commentary, we said the most basic tenet of technical analysis was that a prior support level becomes the new resistance level after the support is broken. The opposite of this is also true, in that a prior area of resistance will become new support after the resistance is broken. Yesterday's price action in the UltraShort Oil and Gas ProShares (DUG) is a prime example of this:

DUG was weak throughout the first half of the day, but it reversed after testing an area of triple convergence. Notice how the 20-MA, 50-MA, and prior downtrend line all converged at the same price. Whenever technical convergence of support is present, the support level becomes even more powerful. Because of this confluence, we raised our stop to $40.88 after buying DUG when it broke out on November 12. It came within 16 cents of our stop yesterday, but rallied steadily into the close. Forming a bullish "hammer" candlestick after a "shakeout" below the gap, we anticipate further price appreciation in today's session.
Open ETF positions:
Long - DUG
Short - EWW, XME
Deron Wagner is the Founder and Head Trader of both Morpheus Capital LP, a U.S. hedge fund, and Morpheus Trading Group, a trader education firm launched in 2001 that provides daily technical analysis of the leading ETFs and stocks. For a free trial to the full version of The Wagner Daily or to learn about Wagner's other services, visit MorpheusTrading.com or send an e-mail to deron@morpheustrading.com.
|