| The Wagner Daily ETF Report for November 8 |
| By Deron Wagner |
Published
11/8/2007
|
Stocks
|
Unrated
|
|
|
|
The Wagner Daily ETF Report for November 8
A massive wave of selling swept Wall Street yesterday, as traders sold into strength of Tuesday's bullish reversal attempt in the S&P 500. The major indices gapped down on the open, then trended steadily lower throughout the entire session. Unlike the past week, there was no intraday indecision. The S&P 500 plunged 2.9%, the Nasdaq Composite 2.7%, and the Dow Jones Industrial Average 2.6%. The small-cap Russell 2000 plummeted 3.2% on a break of its "neckline," pushing our position in the UltraShort Russell 2000 ProShares (TWM) to a 5-point unrealized gain. The S&P Midcap 400 lost 2.3%. Opposite of the previous day, all the main stock market indexes closed at their dead lows.
Total volume in the NYSE rose 15% above the previous day's level, while the Nasdaq turnover increased by just 2%. Most of the increase in trading activity occurred during the final hour's selling frenzy. The broad-based losses on higher volume caused both the S&P 500 and Nasdaq Composite to register a bearish "distribution day," the sixth such session in recent weeks. With more than five such days of institutional selling over the past month, overall odds of profitably trading on the long side of the market are severely diminished. Extremely bearish market internals confirmed yesterday's selling spree. In the NYSE, declining volume outpaced advancing volume by a whopping 14 to 1 margin. The Nasdaq ratio was negative by just over 6 to 1.
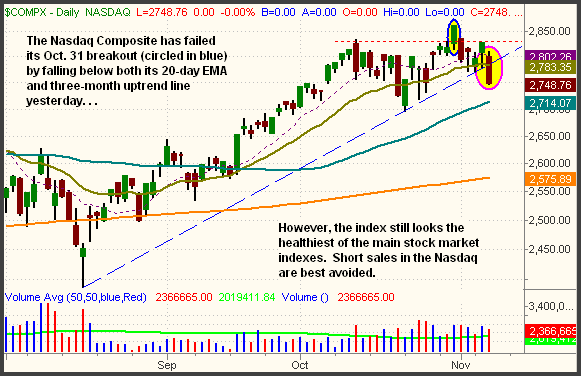
We won't bore you with lots of technical details of just how ugly yesterday's session was, but suffice it to say it was just plain nasty! The tug-of-war we've been seeing between the bulls of the Nasdaq and the bears of the S&P and Dow may be nearing an end, with the bears taking the upper hand. Rarely can the major indices show strong price divergence for an extended period of time before they eventually get in sync with each other. Though the Nasdaq's chart pattern still looks much healthier than the rest, the index has now failed its October 31 breakout attempt by falling below support of its three-month uptrend line. This also coincided with a break of the 20-day EMA:

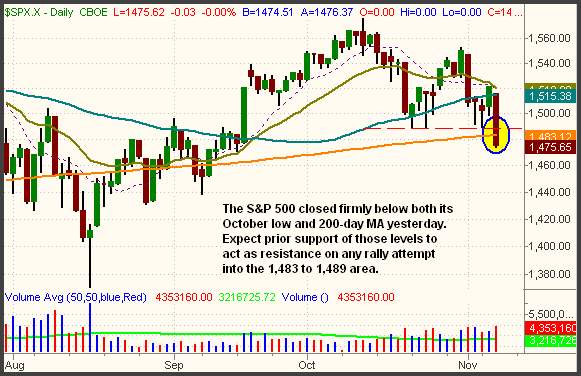
Looking much worse is the S&P 500 Index, which nosedived below support of both its October low and 200-day MA yesterday. This is shown on the daily chart of the S&P below:

Though we expected an eventual test of the October low and 200-day MA in the near future, it was interesting how little deliberation occurred on yesterday's breakdown. Expect prior support of the 1,483 to 1,489 area to now act as significant resistance on any rally attempt. A lot of overhead supply has been left behind in the wake of yesterday's technical damage, so we don't expect the S&P to rapidly snap back to its prior levels, at least in the short-term. Yesterday's close of 1,475 correlates to a 50% Fibonacci retracement from the August low to the October high. If that low is broken, the next major area of support should be found near 61.8% Fibonacci retracement level of 1,449. If that area of support fails to hold, a retest of the August low could be expected.
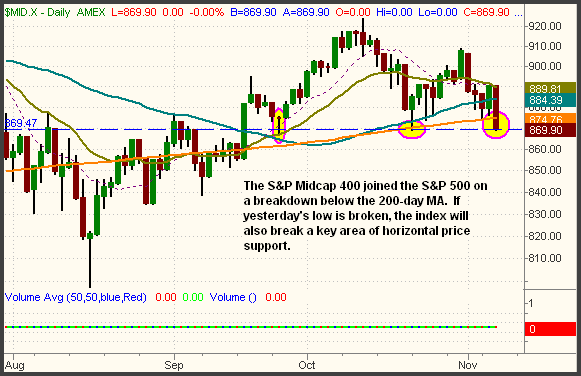
Joining the S&P 500 on a drop below its 200-day MA was the S&P Midcap 400 Index, which is poised to fall below a key area of horizontal price support. The dashed horizontal line on the chart below marks support of the October low, as well as the late September pullback. A drop below that level in today's session could trigger a wave of downside momentum in the mid-cap arena:

The blue-chip Dow remains above its 200-day MA, but has broken below its October low. Expect the index to run into resistance on any rally attempt into the 13,407 to 13,446 range. Support of the 200-day MA is at 13,212.
The small-cap Russell 2000 continues to follow-through on its bearish "head and shoulders" chart pattern, and is still showing the most relative weakness of the major indices. In yesterday's newsletter, we spoke of the trouble that weakness in the Russell 2000 could bring to the overall market, so perhaps we are now beginning to see a manifestation of such. Fortunately, our short position in the Russell is working out quite nicely, though we have now trailed the stop much tighter to protect the gains. Regular subscribers to The Wagner Daily should note the updated stop price below.
Open ETF positions:
Long - TWM (a bearish position)
Short - EWW
Deron Wagner is the Founder and Head Trader of both Morpheus Capital LP, a U.S. hedge fund, and Morpheus Trading Group, a trader education firm launched in 2001 that provides daily technical analysis of the leading ETFs and stocks. For a free trial to the full version of The Wagner Daily or to learn about Wagner's other services, visit MorpheusTrading.com or send an e-mail to deron@morpheustrading.com.
|