|
The Wagner Daily ETF Report for November 2
In yesterday morning's commentary, we concluded by saying, ". . .remember that the market's real reaction to changes in economic policy is usually not seen until one to two days later. The initial volatility on the afternoon of Fed days is typically just a knee-jerk reaction that challenges both bulls and bears. Therefore, it may be wise to avoid aggressive buying of stocks and ETFs until next week." This certainly could not have been more true, as the stock market immediately blew off the bullish close of Wednesday's Fed decision and plunged sharply lower yesterday. Both the S&P 500 and Dow Jones Industrial Average plummeted 2.6%, while the Nasdaq Composite fell 2.3%. The small-cap Russell 2000 Index suffered the most damage, free-falling to a 4.0% loss! The S&P Midcap 400 was lower by 2.2%. All of the major indices finished at their lows of the day, indicating no signs of buying interest or intraday short covering into the close.
Total volume in the NYSE increased by 11%, but Nasdaq volume eased 1% below the previous day's level. The higher volume in the NYSE caused the S&P to register another "distribution day" indicative of institutional selling. Now that more than five days of higher volume selling in the NYSE have appeared in recent weeks, there are low odds of profitably trading on the long side of the S&P and Dow. Since mutual funds, hedge funds, and other institutions represent approximately 75% of the market's average daily volume, fighting against the overall trend of their trading activity is not advisable. However, with many leading tech stocks holding near their highs, it's apparent the Nasdaq has not been under as much institutional distribution.
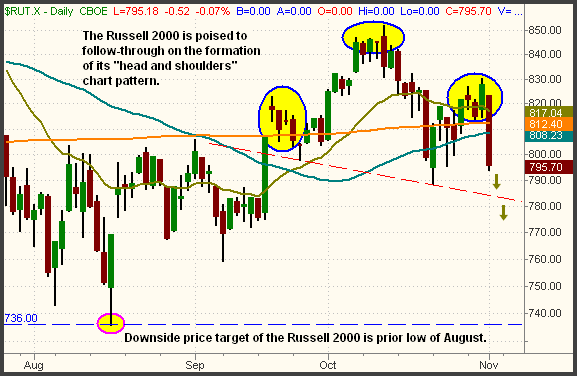
Yesterday, we explained how Wednesday's spastic post-Fed volatility stopped us out of our short position in the Russell 2000. But with the formation of the "head and shoulders" chart pattern still intact, we also said we would consider re-entering the short position if the Russell fell below Wednesday's low. As per the plan, that's exactly what we did. Within the first fifteen minutes of trading, the Russell collapsed below the previous day's low, as well as its 50 and 200-day moving averages. The relative weakness in the index quickly became apparent, but we also needed to show patience and discipline to wait for a bounce, rather than selling short while the index was plummeting. As the market entered its first "reversal period" at 9:50 am ET, the Russell provided us with a short entry on its bounce. Rather than selling short the iShares Russell 2000 (IWM), we sent an intraday e-mail alert to subscribers, informing of our long entry in the inversely correlated UltraShort Russell 2000 ProShares (TWM). Thanks to yesterday's whopping 4% drop in the Russell, the unrealized gain from the TWM re-entry has already made up for a majority of the loss from our first entry. More importantly, yesterday's big drop increases the odds of the "head and shoulders" following through and breaking below the "neckline." Take an updated look at the daily chart of the Russell 2000 below:

When a "head and shoulders" pattern begins to follow through, the predicted drop below the neckline is equal to the distance from the top of the head, down to the neckline. This equates to an approximate drop of 64 points (852 - 788) below the neckline of 788 (at the right shoulder). This gives us a downside target of about 724 on the index. But with the prior low of August at the 736 level, we'll use a test of that support level as an ideal price target. Obviously, we'll also be trailing a stop lower to protect gains along the way, just in case it doesn't follow through all the way down.
Due to morning relative strength in the sector, we covered our short position in the Oil Service HOLDR (OIH) yesterday, securing a gain of just under 4 points. Oil continued to show relative strength all the way into the close. We also sold the remaining half position of the U.S. Natural Gas Fund (UNG) ahead of yesterday morning's natural gas inventory report, netting a 10% (4 point) gain. It subsequently moved a bit higher in the afternoon, but we'll look for a re-entry when it consolidates its recent gains.
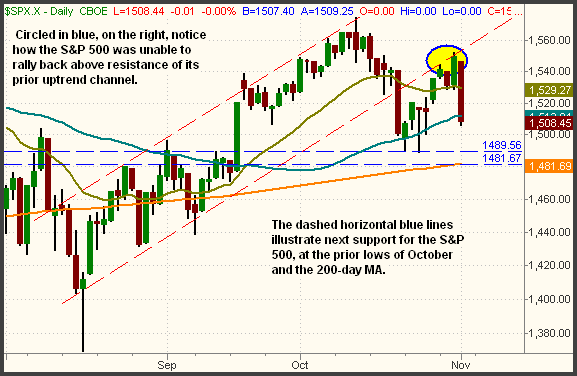
The S&P 500 closed below support of its 50-day MA for the first time since September 17, one day before the surprise rate cut by the Fed. With the index only fractionally higher since that day, it seems the 50-point rate cut by the Fed on September 18 had only a temporary effect of propping up the stock market. The next major support level on the S&P is the range between the 200-day MA (1,481) and the prior low from October (1,489). The daily chart of the S&P shows how the index was unable to rally back above its two-month uptrend line that it fell below on October 19. This is a good example of how a prior support level becomes the new resistance after the support is broken:

The Dow also broke below its 50-day MA yesterday, but is further above support its 200-day MA. The prior low from October, at 13,407, should act as the next support for the Dow. The 200-day MA at 13,192 is a more significant level of support. The Nasdaq is the only one of the main stock market indexes still trading within its intermediate-term uptrending channel. All the other indexes fell below support of their lower-channel boundaries earlier in the month. Although bounces will happen, overall downward momentum in the broad market is pretty substantial right now. Consider new short entries into upward retracements, but not in the Nasdaq.
Open ETF positions:
Long - TWM
Short - (none, but TWM is a bearish position)
Deron Wagner is the Founder and Head Trader of both Morpheus Capital LP, a U.S. hedge fund, and Morpheus Trading Group, a trader education firm launched in 2001 that provides daily technical analysis of the leading ETFs and stocks. For a free trial to the full version of The Wagner Daily or to learn about Wagner's other services, visit MorpheusTrading.com or send an e-mail to deron@morpheustrading.com.
|