| The Wagner Daily ETF Report for November 1 |
| By Deron Wagner |
Published
11/1/2007
|
Stocks
|
Unrated
|
|
|
|
The Wagner Daily ETF Report for November 1
In typical Fed-day fashion, stocks traded quietly in the morning, then whipsawed violently in both directions upon the announcement of the widely anticipated quarter-point rate cut. Both the S&P 500 and Nasdaq Composite fell nearly 1% within fifteen minutes of the 2:15 pm ET economic report, stopping out the bulls who bet on a post-Fed rally, and simultaneously attracting the short sellers who noted the break of the 20-day EMA in the S&P. Then, nearly as rapidly, the broad market reversed course and zoomed to new intraday highs, stopping out the bears and frustrating the bulls who sold at the lows five minutes earlier. With one hour remaining, the main stock market indexes dipped again, but stabilized and rallied back to close near their intraday highs. Aren't Fed days fun? The Nasdaq Composite settled 1.5% higher, the S&P 500 1.2%, and the Dow Jones Industrial Average 1.0%. The small-cap Russell 2000 and S&P Midcap 400 indexes gained 1.5% and 1.7% respectively.
Turnover swelled across the board, enabling both the S&P and Nasdaq to score a bullish "accumulation day." Total volume in the NYSE rose 28%, while volume in the Nasdaq increased 16% over the previous day's level. Yesterday's gain on higher volume was the first sign of institutional buying in the S&P since October 9, two days before the index formed its October peak. Market internals in both exchanges were solid. In the NYSE, advancing volume exceeded declining volume by a healthy margin of 7 to 2. The Nasdaq ratio was positive by just under 3 to 1.
In yesterday's commentary, we illustrated how the Russell 2000 Index was forming the right shoulder of a bearish "head and shoulders" chart pattern. Immediately after the Fed announcement, the Russell fell to its prior day's low, enabling our long position in the UltraShort Russell 2000 (TWM) to rally back to our entry point. However, the post-Fed madness caused the index to cruise right back to a new intraday high. As such, we stopped out of our TWM position when the Russell rallied above the high of its right shoulder. But although we are no longer short the Russell, the "head and shoulders" pattern we showed yesterday is still technically intact. A drop below the 200-day MA and hourly uptrend line in the Russell 2000, which is just below yesterday's low, would provide a valid short re-entry point. Note that entering a short position before the Russell 2000 falls below that level is equivalent to guessing, so be patient if looking for a re-entry.
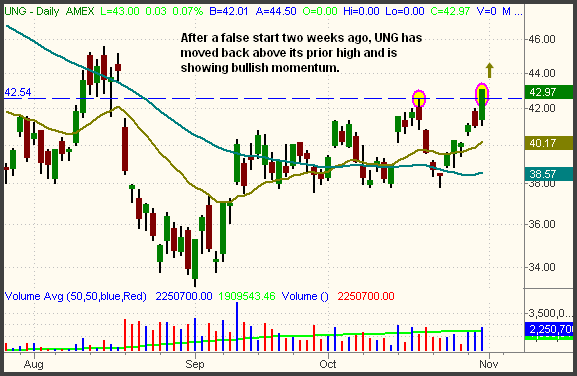
Our long position in the U.S. Natural Gas Fund (UNG) is a good example of why re-entries in good trade setups are sometimes necessary. We initially bought UNG when it broke out above its daily downtrend line and horizontal price resistance in mid-October, both clear signs of a trend reversal. However, we stopped out a few days later because the trade apparently got off to a false start. Still liking the setup, we bought UNG again two days later, when it rallied back above its 50-day MA. The re-entry worked well, as UNG moved back to its prior high and broke out above it yesterday. We locked in the gain on partial share size two days ago, but are currently showing an unrealized gain of 10% (4 points) on the second half of the position. The profit on the re-entry has now surpassed the loss on the first entry. The daily chart of UNG below shows yesterday's breakout above the range:

Though one cannot be afraid to re-enter trades that just stopped out, there is one key point of this whole concept. The setups must still be technically valid! If an objective analysis of the trade setup no longer shows a technical reason for entry, then a re-entry is akin to merely "revenge trading." Clearly, this is not a path you want to go down. But as long as you would still enter the trade if you never entered the first time around, re-entries are not a problem. Even if you need to pay up a point or two above your original exit price, netting four points out of a potential six-point gain is still better than gaining nothing at all.
Overall, trading concluded with a bullish bias yesterday. Both the S&P 500 and Dow Jones Industrials still have overhead resistance from their October highs, but the Nasdaq Composite closed at a fresh six-year high. Nevertheless, remember that the market's real reaction to changes in economic policy is usually not seen until one to two days later. The initial volatility on the afternoon of Fed days is typically just a knee-jerk reaction that challenges both bulls and bears. Therefore, it may be wise to avoid aggressive buying of stocks and ETFs until next week. If the market holds firmly through the rest of this week and early next week, the next intermediate-term move could be higher.
Open ETF positions:
Long - UNG
Short - OIH
Deron Wagner is the Founder and Head Trader of both Morpheus Capital LP, a U.S. hedge fund, and Morpheus Trading Group, a trader education firm launched in 2001 that provides daily technical analysis of the leading ETFs and stocks. For a free trial to the full version of The Wagner Daily or to learn about Wagner's other services, visit MorpheusTrading.com or send an e-mail to deron@morpheustrading.com.
|