| The Wagner Daily ETF Report for October 26 |
| By Deron Wagner |
Published
10/26/2007
|
Stocks
|
Unrated
|
|
|
|
The Wagner Daily ETF Report for October 26
Another tug-of-war between the bulls and bears left the major indices flat to modestly lower yesterday. Stocks sold off in the first thirty minutes, reversed to new intraday highs later in the morning, fell to fresh intraday lows at mid-day, then moved back up in the final ninety minutes of trading. Percentage changes in the Nasdaq Composite and Dow Jones Industrial Average were, respectively, at 0.9% lower and unchanged, identical with the previous day. The S&P 500 ticked just 0.1% lower. The small-cap Russell 2000 fell 0.6% and the S&P Midcap 400 lost 0.5%. Overall, it was another choppy, indecisive day that led to the main stock market indexes closing near the middle of their intraday ranges.
Total volume in the NYSE increased 1%, while volume in the Nasdaq came in 3% lighter than the previous day's level. The marginal 0.1% loss and mere 1% increase in turnover was not enough to label the S&P as having registered another "distribution day." Market internals in both exchanges remained negative. Declining volume in the Nasdaq exceeded advancing volume by just under 3 to 1. The NYSE ratio was only fractionally negative.
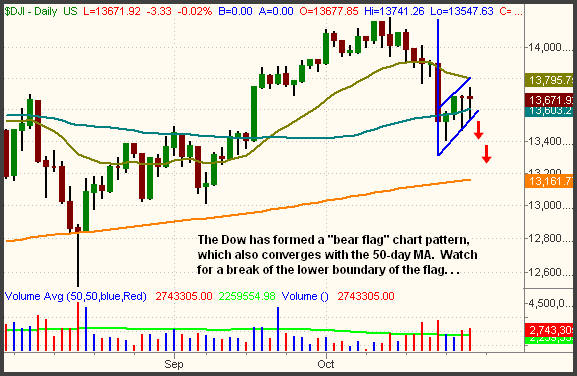
The Dow Jones Industrial Average has closed higher or flat in each of the past four sessions. However, the index is now forming a "bear flag" chart pattern on its daily chart. This chart pattern is annotated on the chart below:

When a "bear flag" is formed, it usually leads to new lows after the lower boundary support of the flag is broken. A breakdown below yesterday's low would represent such a break of lower boundary support, increasing the odds of another leg down in the Dow. Further, support of the 50-day MA also converges with the formation of the "bear flag." Therefore, follow-through in the Dow "bear flag" would also coincide with a simultaneous break of the 50-day MA. If the Dow breaks below yesterday's low and its 50-day MA, we will likely initiate a new short position. This would be best accomplished through buying the inversely correlated, leveraged UltraShort Dow 30 ProShares (DXD) on a breakout above yesterday's high. The S&P 500 has a similar chart pattern, one that presents a decent short entry below yesterday's low (or above the high on the UltraShort S&P ProShares (SDS)).
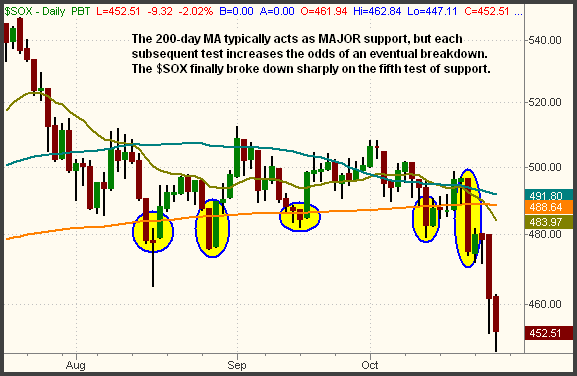
Two days ago, the former relative strength we observed in the Nasdaq began to fade. The biggest reason was the collapse in the Semiconductor Index ($SOX), which firmly broke below its 200-day moving average after its fourth test of support in the past three months. Though a 200-day MA always provides very powerful support or resistance, each subsequent test of the support increases the chances of an eventual breakdown below it. Looking at the daily chart of the $SOX below, notice how it was the fifth test of the 200-day MA that finally "broke the camel's back:"

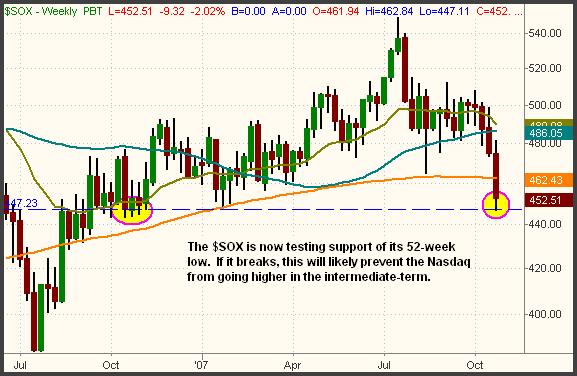
The longer-term weekly chart below shows the $SOX is now testing support of its 52-week low. Just as a breakout to a new 52-week high is bullish and generally leads to much higher prices, a breakdown to a new 52-week low often leads to much lower prices:

Even if not trading in the Semiconductor ETFs, it is important to continually observe the price action in the sector because the $SOX Index is so heavily weighted within the Nasdaq. Rarely will the Nasdaq continue to rally while the $SOX is in a downtrend. Prior to a few days ago, relative strength in biotech and other tech sectors helped the Nasdaq to ignore the sideways action in the semis, but that doesn't seem to be the case now that the $SOX has convincingly broken down below its 200-day MA. Continue watching the price action in the $SOX as a proxy and leading indicator for the direction of the Nasdaq.
Open ETF positions:
Long - UNG, TLT, TWM
Short - (none, though TWM is a bearish position)
Deron Wagner is the Founder and Head Trader of both Morpheus Capital LP, a U.S. hedge fund, and Morpheus Trading Group, a trader education firm launched in 2001 that provides daily technical analysis of the leading ETFs and stocks. For a free trial to the full version of The Wagner Daily or to learn about Wagner's other services, visit MorpheusTrading.com or send an e-mail to deron@morpheustrading.com.
|