| The Wagner Daily ETF Report for October 25 |
| By Deron Wagner |
Published
10/25/2007
|
Stocks
|
Unrated
|
|
|
|
The Wagner Daily ETF Report for October 25
Stocks got off to an unnerving start yesterday morning, as the Nasdaq Composite plummeted 2.8% within the first two hours of trading. But afternoon rumors of a surprise Fed rate cut in the coming week caused the major indices to erase a majority of their losses by the closing bell. The Nasdaq finished "only" 0.9% lower, both the S&P 500 and S&P Midcap 400 indexes lost 0.2%, and the Dow Jones Industrial Average was unchanged. The small-cap Russell 2000 essentially followed the Nasdaq, trimming its maximum intraday loss of 2.8% to just 0.9%. The main stock market indexes finished just below their intraday highs, marking the third straight day of bullish price action into the close.
Turnover was higher across the board. Total volume in the NYSE ticked 21% higher, while volume in the Nasdaq came in 14% above the previous day's level. The losses on higher volume technically caused both the S&P and Nasdaq to register another "distribution day." However, two factors prevented us from confidently declaring yesterday to be a bearish day of institutional selling. First, it's important to note that all of the major indices closed near their highest levels of the day, after recovering from steep losses earlier in the session. This bullish price action caused the formation of "hammer" candlesticks on the daily charts, which counteracted the declaration of yesterday being a "distribution day." Second, we noted that volume increased slightly more during the late afternoon rally than during the morning sell-off. This means institutional buying pressure slightly had the upper hand over the bears. Nevertheless, market internals remained pretty weak, even while the buying programs were under way. In the Nasdaq, declining volume still exceeded advancing volume by a margin of nearly 4 to 1. The NYSE ratio was better, negative by only 3 to 2.
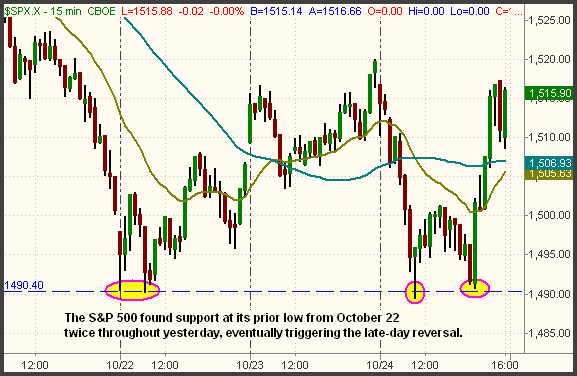
Although rumors of an unannounced interest rate cut by the Federal Reserve Board may have spurred momentum of the afternoon rally, there were also several technical factors at work. Specifically, the S&P 500 reversed after testing support of the prior intraday low from October 22. This happened on two separate occasions yesterday, clearly illustrating how well prior lows and prior highs act as support and resistance levels. The 15-minute intraday chart of the S&P 500 shows the potential short-term double bottom off the October 22 low:

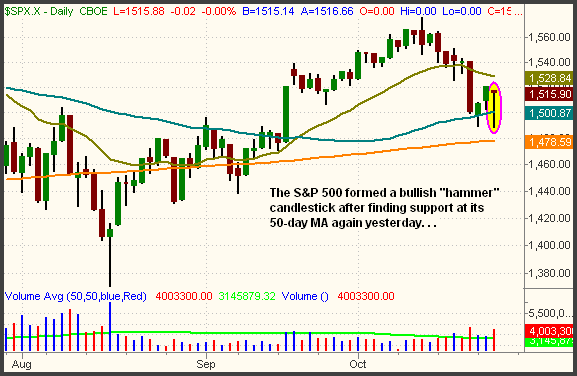
When one area of support coincides with another on a longer time interval, the support becomes even more important. In the case of the S&P, another test of the 50-day MA gave traders another excuse to initiate buying programs in the afternoon. The bounce off the 50-day MA, as well as yesterday's bullish "hammer" candlestick is circled on the daily chart of the S&P 500 below:

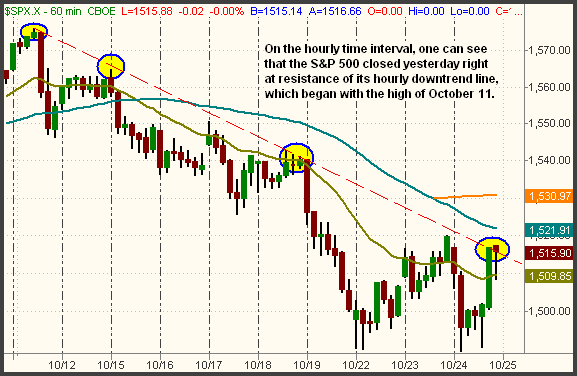
The bounce off the prior low and 50-day MA was bullish, but now the index must test resistance of its hourly downtrend line that has began with the high of October 11. Notice how the index closed right at its hourly downtrend line yesterday:

If the S&P manages to move above its hourly downtrend line, it will face another test of significant resistance at its 20-day EMA, presently at the 1,528 level. This can be seen as the beige line on the daily chart interval two charts above. Overall, the three charts above, each of the same index, are a great example of how the technical picture can easily change from one time interval to another. The same chart that looks bullish on a 15-minute timeframe, for example, can be bearish on an hourly timeframe. For this reason, it's crucial to always check for major support and resistance levels on various timeframes, not just the daily charts.
With the S&P trapped between the near-term support and resistance levels shown on the charts above, I expect a bit of chop over the next few days. The kind of erratic, indecisive price action that we saw yesterday could easily be repeated, so we suggest not being overly aggressive on new trade entries at current levels. The Nasdaq, of course, looks much better and could break free to new highs with just one strong "up" day, but don't forget that the index has still had at least five days of institutional selling in recent weeks. Schizophrenic markets, as we may be entering, require a defensive stance, as well as patience to wait for the proper trade setups to present themselves.
Open ETF positions:
Long - TLT, UNG, TWM
Short - OIH
Deron Wagner is the Founder and Head Trader of both Morpheus Capital LP, a U.S. hedge fund, and Morpheus Trading Group, a trader education firm launched in 2001 that provides daily technical analysis of the leading ETFs and stocks. For a free trial to the full version of The Wagner Daily or to learn about Wagner's other services, visit MorpheusTrading.com or send an e-mail to deron@morpheustrading.com.
|