| The Wagner Daily ETF Report for October 23 |
| By Deron Wagner |
Published
10/23/2007
|
Stocks
|
Unrated
|
|
|
|
The Wagner Daily ETF Report for October 23
Briefly following through on last Friday's ugly session, stocks got off to a shaky start yesterday morning, causing the Nasdaq to gap one percent lower on the open. But support of its prior high from July enabled the Nasdaq Composite to promptly turn around, eventually recovering 1.1% of the previous day's loss by the closing bell. As anticipated, both the S&P 500 and Dow Jones Industrial Average found support at their 50-day moving averages as well, though they lacked the strength of the tech stocks. The S&P and Dow bounced 0.4% and 0.3% respectively. The small-cap Russell 2000 erased 1.4% of the prior day's 3.2% loss, while the S&P Midcap 400 gained 0.7%. Despite some indecision throughout the day, all of the major indices managed to close near their intraday highs.
The one key element missing from the recovery attempt was higher overall volume. Total volume in the NYSE declined 22%, as volume in the Nasdaq receded 20% below the previous day's level. With five recent "distribution days" on the board, yesterday's gains would have been more convincing if higher turnover had accompanied them. Nevertheless, it was positive that volume in both exchanges still exceeded 50-day average levels. Market internals were positive, but not by a wide margin. Advancing volume in the NYSE exceeded declining volume by 3 to 2. The Nasdaq ratio was positive by just under 3 to 1.
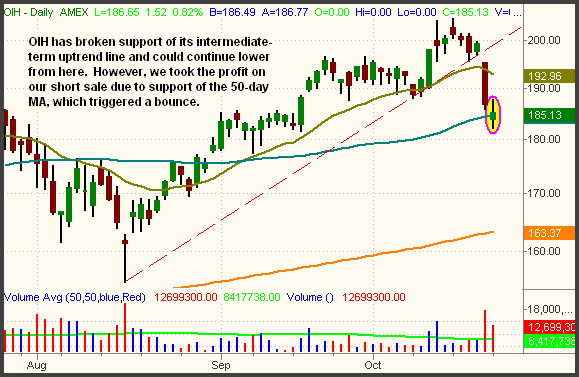
The Oil Service HOLDR (OIH) has broken down below support of its intermediate-term uptrend line and is likely to retrace further before stabilizing. However, we took the quick profit on our short sale in OIH because it was only intended to be a momentum trade, anticipating a rapid drop down to its 50-day MA. Our original price target was achieved rather quickly, when OIH gapped down to open at its 50-day MA yesterday morning. We therefore covered the position on the open, netting an 8-point gain on a 2-day hold:

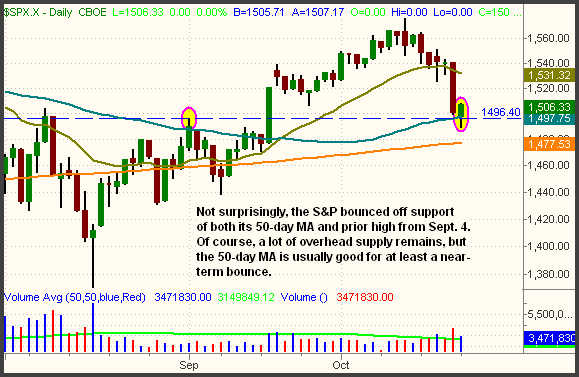
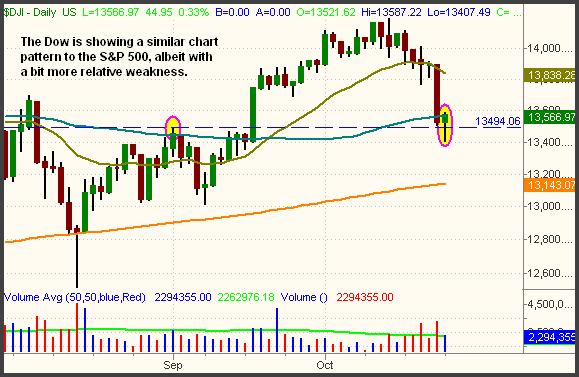
In yesterday's newsletter, we illustrated how both the S&P and Dow closed last week near support of their 50-day moving averages. Many institutions use the 50-day moving average as a simple indicator for when to buy stocks on a pullback, and the same is true of the major indexes. As such, we were not surprised that the broad market bounced a bit yesterday. Although the opening weakness trapped short sellers who were "late to the party," an index rarely collapses right through support of its 50-day MA without attempting to bounce off of it at least once. Yesterday was the first time the S&P and Dow touched their 50-day MAs since the stock market surged with the surprise Fed rate cut on September 18. Again, notice how support of the 50-day MAs also coincided with horizontal price support from the September 4 highs:


As both the S&P and Dow have given back nearly all the Fed-induced gains of the past four weeks, it appears the excitement and knee-jerk reaction from the September 18 interest rate cut may have faded. From here, the intermediate-term direction of the market may largely depend on the reaction to the remainder of corporate earnings reports on deck in the coming weeks. Given that a few negative blue-chip earnings reports spooked the market last Friday, it's not unrealistic to say that the presence of any more large cap profit warnings or missed earnings estimates could trigger another sell-off that sends the S&P and Dow back down to test their August lows.
The current environment remains a "tale of two markets," one in which traders can profitably sell short weak sectors in the S&P and Dow, while simultaneously buying most sectors with relative strength in the Nasdaq. Both the Nasdaq Composite and Nasdaq 100 continue to show the most relative strength and have healthier overall chart patterns. In the "big picture," compared to the S&P and Dow, the Nasdaq brothers also have a lot more ground to recover from their year 2000 highs down to its year 2002 lows. While the S&P and Dow recovered all of their losses and moved to new all-time highs, the Nasdaq indexes retraced to only their 38.2% Fibonacci retracements. If the broad market manages to stabilize near current levels, expect the Nasdaq indices to be the first of the broad-based indexes to zoom back to new highs. If buying the market right now, the Nasdaq is clearly the place to be, but watch out for any potential bombs that could shake up the S&P and Dow.
Open ETF positions:
Long - UNG
Short - XLU
Deron Wagner is the Founder and Head Trader of both Morpheus Capital LP, a U.S. hedge fund, and Morpheus Trading Group, a trader education firm launched in 2001 that provides daily technical analysis of the leading ETFs and stocks. For a free trial to the full version of The Wagner Daily or to learn about Wagner's other services, visit MorpheusTrading.com or send an e-mail to deron@morpheustrading.com.
|