| The Wagner Daily ETF Report for October 16 |
| By Deron Wagner |
Published
10/16/2007
|
Stocks
|
Unrated
|
|
|
|
The Wagner Daily ETF Report for October 16
After a short-lived bounce off support of their 10-day moving averages, the major indices resumed their downward slide that began last Thursday. The bears immediately took control after a relatively flat open, sending stocks into a steady downward trend throughout the entire session. The broad-based losses caused the Nasdaq Composite to fall 0.9%. Both the S&P 500 and Dow Jones Industrial Average slid 0.8%. The small-cap Russell 2000 and S&P Midcap 400 indices were lower by 1.4% and 0.7% respectively. A bounce in the final thirty minutes of trading lifted stocks off their worst levels, but all of the main broad-based indexes still closed in the bottom third of their intraday ranges.
As with the October 11 losses, the stock market fell victim to higher turnover in both exchanges. Total volume in the NYSE increased 17%, while volume in the Nasdaq was 4% higher than the previous day's level. Declining volume exceeded advancing volume by approximately 3 to 1 in both exchanges. The losses on higher volume caused both the S&P and Nasdaq to register a bearish "distribution day" that was indicative of institutional selling. Since the beginning of the month, the Nasdaq has had four "distribution days." The NYSE has had three. A healthy market can typically absorb the supply created by two to three "distribution days" within a four-week period, but the presence of four or more such days of institutional selling in a short period is definitely a warning sign to astute traders. When an index flashes five or more instances of institutional selling in just a few weeks, a substantial pullback is usually imminent. Remember that stocks eventually follow the overall direction of institutional trading activity, which makes itself known in the form of bullish "accumulation days" and bearish "distribution days." Currently, the latter indicator is present and dominant.
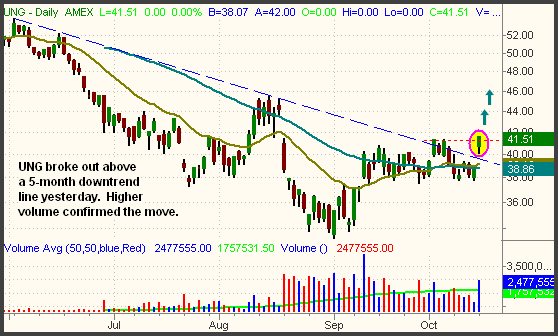
With crude oil back to a new 52-week high, most of the oil-related ETFs have also been strong. However, natural gas prices have just begun to make a stealthy upward move as well. Yesterday, natural gas leapt 35 cents (5%) to $7.32 per million BTU. This caused the newly-formed United States Natural Gas Fund (UNG) to surge 6.6% and zoom above a five-month downtrend line. On the daily chart of UNG below, notice the confirmation of higher volume on yesterday's breakout as well:
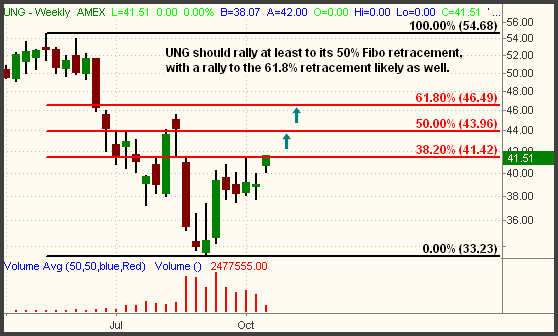
As of now, UNG has already retraced to just beyond its 38.2% Fibonacci retracement from the May high to the September low. Momentum from its break of the five-month downtrend line should carry UNG at least to its 50% Fibo retracement, near $44. Beyond that, resistance of the 61.8% Fibo retracement (around $46.50) would be the next upward target. Below is a longer-term weekly chart of UNG with Fibonacci retracement lines applied. Moving averages and trendlines have been removed so that you can more easily see the Fibonacci retracement levels:
Now that UNG has broken out above its five-month downtrend line, we'll be looking for a long entry over the next few days. Ideally, the best reward-risk ratio would occur on a pullback to just above new support of the prior downtrend line (near yesterday's intraday low). A protective stop would then be placed below convergence of the 20- and 50-day moving averages, both of which lie just below the trendline. Of course, UNG may not give us such an ideal pullback. In that case, we would still probably buy over yesterday's high, but would reduce our share size in order to account for the higher risk of a pullback immediately after entry. Having smaller share size would enable us to have a wide enough stop to not get shaken out prematurely, but without increasing our overall capital risk.
In yesterday's Wagner Daily, we looked at key support levels in the S&P 500, Nasdaq Composite, and Dow Jones Industrials. Both the S&P and Dow closed below their prior highs from July yesterday, removing them from multi-year and historical high territory that they briefly enjoyed. Nevertheless, both indexes remain above their 20-day EMAs, which we expect them to test today. Despite yesterday's drop, the Nasdaq is still above both its 20-day EMA and 10-day MA. On a technical level, the Nasdaq still has the most relative strength of the major indices. You may wish to review yesterday's commentary to refresh your mind of the detailed support levels the main stock market indexes may test if the downward pressure continues into today's session.
Open ETF positions:
Long - LQD
Short - IWM, HHH
Deron Wagner is the Founder and Head Trader of both Morpheus Capital LP, a U.S. hedge fund, and Morpheus Trading Group, a trader education firm launched in 2001 that provides daily technical analysis of the leading ETFs and stocks. For a free trial to the full version of The Wagner Daily or to learn about Wagner's other services, visit MorpheusTrading.com or send an e-mail to deron@morpheustrading.com.
|


 Free Festival of Traders Videos