|
The Wagner Daily ETF Report for October 12
After gapping higher on the open, the major indices held their own throughout the morning, but a sharp sell-off in the early afternoon abruptly reversed the overall market's course. Fueled by substantial selling in the tech arena, stocks fell steadily and rapidly after Wall Street returned from its lunch break. The Nasdaq Composite, which has led the broad market higher over the past month, showed the most relative weakness yesterday. The Nasdaq fell 1.4%, as the small-cap Russell 2000 followed with a 1.2% loss. The S&P 500 and Dow Jones Industrial Average each shed only 0.5%, but note that both indexes were showing gains of 0.9% at their mid-day highs. On an intraday basis, the market's afternoon plunge was more vicious than one would assume from merely seeing the closing numbers. A modest bounce in the final thirty minutes of trading lifted stocks off their worst levels, but all of the main stock market indexes still settled in the bottom quarter of their intraday ranges.
The most negative thing about yesterday's session was not the actual losses, but the firmly higher turnover that accompanied them. In both the NYSE and Nasdaq, total volume surged 30% above the previous day's levels. The institutional selling, confirmed by the markedly higher volume, caused both the S&P and Nasdaq to register a bearish "distribution day." More notably, the 2.5 billion shares that changed hands in the Nasdaq was the highest since August 17, the day after the market formed its intermediate-term bottom. Below is a daily chart of the Nasdaq's volume. Each green bar represents the total volume for one day.

Notice how turnover not only moved back above its 50-day MA, but also exceeded volume of the bullish September 18 session driven by the Fed rate cut. This is bearish because it tells us institutions such as mutual funds, hedge funds, and other big players were rushing for the exit doors. Ideally, it would have been more positive for the market if volume on the big "up" day of September 18 was higher than the volume that coincided with yesterday's bearish reversal.
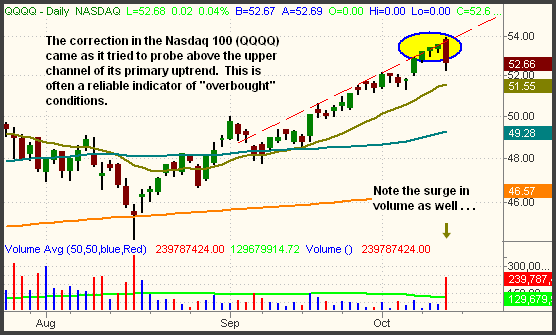
Yesterday's action was damaging on a technical level because it was more indicative of a key reversal day than just a normal pullback. Several factors made it so. First, as discussed above, there was sharply higher volume in both exchanges. Second, the broad market's intraday price action caused "bearish engulfing" candlestick patterns to form on many sectors and indexes. This type of pattern occurs when a stock or index gaps open above the previous day's intraday high, but later closes below that day's intraday low. The price action "engulfs" the previous day's trading range. When this pattern forms in the upper end of an extended rally, it often marks a short to intermediate-term top, especially when accompanied by sharply higher volume. The "bearish engulfing" candle is easily seen on the daily chart of the PowerShares Nasdaq 100 (QQQQ) below. Notice also how the reversal occurred after QQQQ began to push above the upper channel of its primary uptrend:

In the October 10 issue of The Wagner Daily, we said of the Nasdaq's technical state at the time that, "Though a strongly trending index can hug the upper channel of an uptrend for a long time, one of the most reliable indicators for an index being "overbought" is when it climbs above the upper channel. This, of course, does not mean that it will immediately snap back into the range of the primary ascending channel. However, it does mean that stops on long positions should be trailed tightly and new long positions should probably be avoided until a decent correction eventually comes." As such, it was not overly surprising that yesterday's correction in the Nasdaq coincided with a failed probe above the upper channel of the intermediate-term uptrend. Neither the S&P 500 nor Dow Industrials fell as hard as the Nasdaq Composite and Nasdaq 100 yesterday, but that's also because the S&P and Dow were not extended beyond the upper channel of their primary uptrends. When indexes get overheated to the upside, they also fall the hardest when the inevitable correction eventually comes.
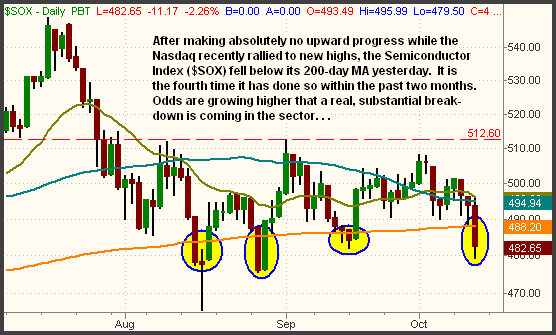
The Semiconductor Index ($SOX) fell below its 200-day moving average again, marking the fourth time it has done so within the past two months. The $SOX has shown relative weakness throughout the entire rally off the August lows, so yesterday's 2.3% drop that came on the heels of the first pullback in the Nasdaq was not shocking. Though a 200-day moving average typically acts as major support for an index, each subsequent probe below the pivotal moving average increases the odds of a confirmed breakdown. Because it never even rallied with the Nasdaq in recent weeks, we think there's now a good chance the $SOX will fall to at least test its August 16 low:

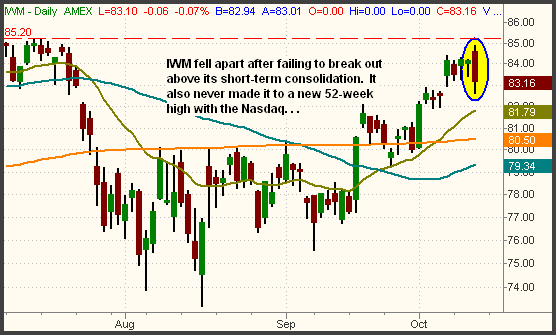
When stocks bounced off their lows just before 3:00 pm ET yesterday, we sent an intraday e-mail alert to subscribers, informing them we were selling short the iShares Russell 2000 Index (IWM). We chose a short sale in that index for several reasons. Not only did it stall just shy of its prior high from July, never making it to a new 52-week high, but the index also failed the breakout of its short-term consolidation. The bearish engulfing candle, failed breakout, and high volume selloff gave us confidence the Russell would at least be a solid short-term momentum play to the downside. Our initial stop is tight, just above yesterday's high, and we plan to continue trailing it tighter as we are able. The daily chart of IWM is shown below:

In strong uptrends, the 10-day MA often coincides with support of the hourly uptrend lines. Yesterday, most of the main stock market indexes found support at their 10-day moving averages, closing at or just above them. This could enable the major indices to attempt to stabilize today, but the strong sell-off volume and "bearish engulfing" candlesticks means that yesterday's lows probably will not hold for long. Just in case the intensity of the new correction increases, we'll take an updated technical look at the next major support levels for the S&P, Nasdaq, and Dow in tomorrow's commentary. Until then, be sure to honor your protective stops on all long positions. Above all, remember to trade what you see, not what you think!
Open ETF positions:
Long - GDX, LQD
Short - IWM
Deron Wagner is the Founder and Head Trader of both Morpheus Capital LP, a U.S. hedge fund, and Morpheus Trading Group, a trader education firm launched in 2001 that provides daily technical analysis of the leading ETFs and stocks. For a free trial to the full version of The Wagner Daily or to learn about Wagner's other services, visit MorpheusTrading.com or send an e-mail to deron@morpheustrading.com.
|