| The Wagner Daily ETF Report for September 27 |
| By Deron Wagner |
Published
09/27/2007
|
Stocks
|
Unrated
|
|
|
|
The Wagner Daily ETF Report for September 27
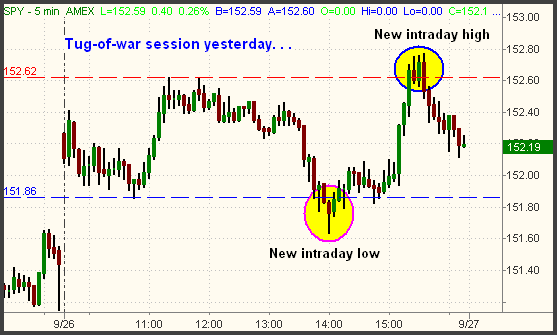
An indecisive session concluded with a round of broad-based gains yesterday, as the S&P and Dow continued to consolidate their gains from last week's breakout, rising 0.5% and 0.7% respectively. The Nasdaq Composite maintained the week's relative strength by breaking out above its near-term trading range and gaining 0.6%. Both the small-cap Russell 2000 and S&P Midcap 400 indices rallied 0.8%. Though the closing gains were solid, the intraday trading action was far from it. The S&P 500 gapped higher on the open, moved above the opening high just before mid-day, then promptly dropped to a new intraday low and a nearly unchanged price level in the early afternoon. The bulls fought back in the final hour, pushing the S&P 500 all the way to a new intraday high, but the bears stepped in again during the final thirty minutes. It was a dizzying session overall. Yesterday's tug-of-war between the bulls and bears is shown on the 5-minute chart of the S&P 500 SPDR (SPY) below:

Total volume in the Nasdaq increased 7% over the previous day's level, indicating the presence of institutional buying. It was the third such "accumulation day" in the Nasdaq since last week's breakout. Turnover in the NYSE was milder, coming in 3% lighter. The S&P has had two recent days of accumulation, but has begun showing slight relative weakness to the Nasdaq. Advancing volume in the Nasdaq exceeded declining volume by 3 to 2, while the NYSE ratio was positive by 2 to 1 yesterday.
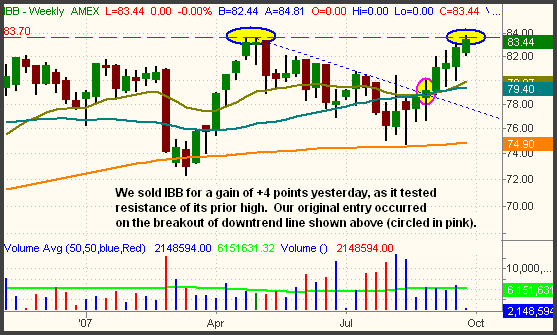
Yesterday, we sold the remaining half position of the iShares Nasdaq Biotech Fund (IBB) as it tested resistance of its prior high. That was in line with our original plan, as we expected a rally up to the prior high, followed by a period of price consolidation. We sold into strength after IBB came within five cents of our price target, just above the April 26 high. This is illustrated on the weekly chart of IBB below:

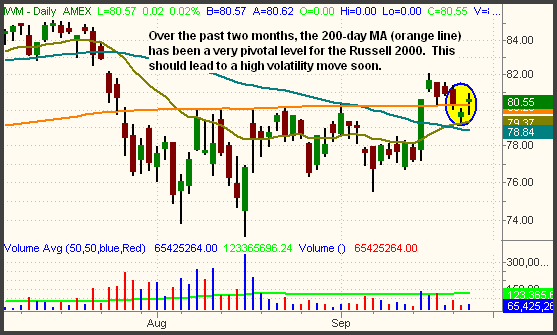
The small-cap Russell 2000 is likely to make a big move in the coming week, but the question is which direction it will go. Throughout August and early September, the 200-day moving average acted like a brick wall, perfectly stopping all rally attempts dead in their tracks. Not surprisingly, last week's Fed announcement triggered enough momentum for the index to break out above its 200-day MA, but not convincingly so. Two days ago, the Russell fell back below its 200-day MA, then grinded its way back above it yesterday. The magnetic properties of the 200-day MA are shown below on the daily chart of the iShares Russell 2000 Index (IWM):

If it can hold above its 200-day MA for the next several days, IWM could see a substantial burst of upward momentum in the intermediate-term. However, compared to the other main indexes, the Russell has been lagging quite a bit. Compared to the S&P, Nasdaq, and Dow notice how far the Russell 2000 remains below its 52-week high. It's merely moved sideways while the rest of the broad market moved higher. Because of this relative weakness, we think there's a good chance the next major move in the index will be lower. Whichever way it goes, the volatility of the move should be rather high. The longer an index remains glued to a pivotal area of support/resistance, the more powerful the eventual breakout or breakdown will be.
The S&P 500 and Dow Industrials bounced off support of their hourly uptrend lines for the second straight day, though both indexes were in danger of breaking down before the buyers saved the day in the final hour. If either of the indexes fall below yesterday's lows, they will have also broken support of their hourly uptrend lines. We intend to "dip a toe in the water" by initiating a near-term short sale if that occurs. Note that we are not really bearish on the market right now, but we think the risk/reward of a downward momentum trade is pretty good near current levels. Trying to guess where the market will form a short-term top is dangerous, but waiting for some type of confirmation of a trend reversal is not. A breakdown below yesterday's lows in any of the major indexes would provide us with exactly that.
Open ETF positions:
Long - LQD
Short - (none)
Deron Wagner is the Founder and Head Trader of both Morpheus Capital LP, a U.S. hedge fund, and Morpheus Trading Group, a trader education firm launched in 2001 that provides daily technical analysis of the leading ETFs and stocks. For a free trial to the full version of The Wagner Daily or to learn about Wagner's other services, visit MorpheusTrading.com or send an e-mail to deron@morpheustrading.com.
|