|
The Wagner Daily ETF Report for September 24
Stocks capped the week on a positive note, as the major indices registered moderate gains last Friday. The Dow Jones Industrial Average advanced 0.4%, the S&P 500 0.5%, and the Nasdaq Composite 0.6%. The small-cap Russell 2000 and S&P Midcap 400 indexes rallied 0.4% and 0.2% respectively. As with last Wednesday, all of the gains were the result of an opening gap up. The broad market subsequently moved in a narrow, sideways range throughout the entire session. Most of the main stock market indexes settled near the middle of their intraday ranges, but near their highest levels of the week.
Turnover rocketed higher in both exchanges, though "quadruple witching" options expiration day was largely responsible for the increased activity. Total volume in the NYSE rose 62% above the previous day's level, while volume in the Nasdaq increased 31%. When stock index futures, stock index options, stock options and single stock futures (SSF) all simultaneously expire once per quarter, it typically results in substantially higher volume in the markets. Nevertheless, trading in both the NYSE and Nasdaq was at its highest levels in more than a month. Market internals were mildly positive. In both exchanges, advancing volume exceeded declining volume by approximately 2 to 1.
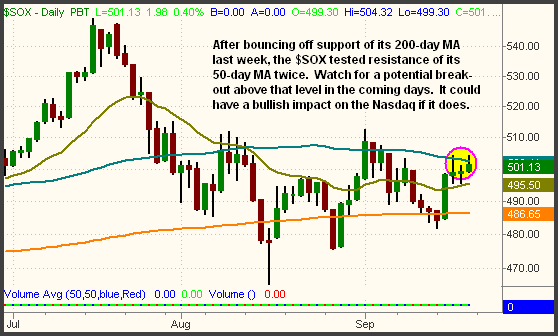
Last week, the heavily weighted Semiconductor Index ($SOX) bounced off support of its 200-day MA and tested resistance of its 50-day MA on both September 19 and 21. Though it closed below its 50-day MA both times, we're keeping an eye on the index this week because a solid close above its 50-day MA could trigger substantial upside momentum in the Nasdaq. It could also lead to short-term momentum trades in associated ETFs such as the Semiconductor HOLDR (SMH), iShares Semiconductor (IGW), or the PowerShares Dynamic Semiconductors (PSI). The $SOX test of its 50-day MA is shown below:

For the week, the S&P 500 gained 2.8% and the Nasdaq Composite tacked on 2.7%. Though the weekly gains were technically among the highest of the year, most of the rally occurred within the span of just several hours. Unless you bought stocks immediately within the two hours that followed Tuesday afternoon's Fed announcement on interest rates, there was not much of a chance to participate in intraday price gains. Fully all of the market's subsequent gains on Wednesday and Friday of last week were the result of opening gaps, denying traders and investors the opportunity to easily participate in the bullish environment.
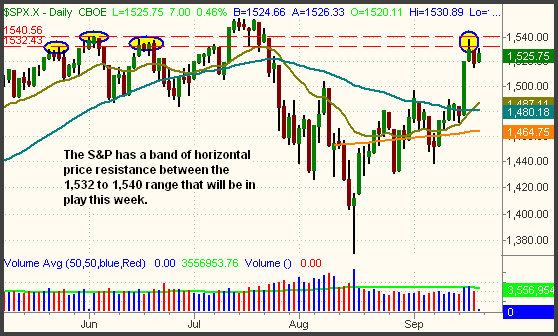
Can we expect more gains in the week ahead or did the market already expend most of its ammo? Chances are that several of the major indices will at least attempt to test their prior highs from July, but they will first need to move above resistance of last week's highs. The S&P 500, for example, has a band of horizontal price resistance between the 1,530 to 1,540 area. This is illustrated on the daily chart below:

Resistance of the prior high from June (1,540) stopped the rally attempt on September 19. The other area of horizontal resistance around the 1,532 level held the S&P's advance in check two days later. In the coming days, we'll be watching the price action in the benchmark S&P 500 to see whether or not enough momentum exists to propel the index above this band of resistance. If so, a test of the 52-week high from July will be imminent. If not, we could expect a pullback down to support of the 1,500 area. Both the prior high from September 4 (1,496) and the hourly uptrend line of the S&P 500 (presently at 1,505) should act as support on any correction.
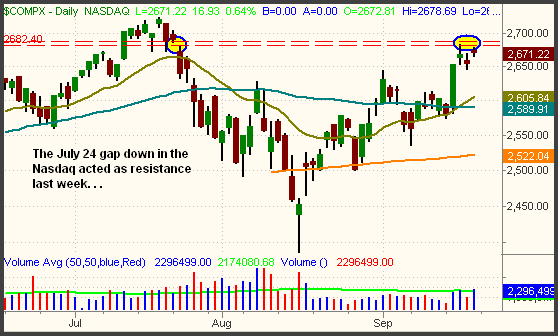
Last week's high in the Nasdaq Composite was marked by horizontal price resistance from the gap of July 24. Opening price gaps in either direction often act as subsequent areas of support or resistance. We've marked this on the daily chart of the Nasdaq Composite below:

As for support, we again look to the September 4 high (2,644). Notice how this level was already successfully tested with the low of the September 20 retracement. Below that level, the next major area of support is convergence of the 20-day EMA and the prior downtrend line from the high of July, around the 2,605 area.
The overall market's volume patterns improved last week, enabling both the S&P and Nasdaq to score two confirmed bullish "accumulation days," with an additional day of institutional buying driven by options expiration. Higher volume gains are necessary in order to drive the markets higher, but watch out for any sudden bouts of distribution that creep into the market this week. Such an occurrence would be a warning signal of an imminent pullback.
Open ETF positions:
Long - OIH, PBW, IBB, LQD
Short - (none)
Deron Wagner is the Founder and Head Trader of both Morpheus Capital LP, a U.S. hedge fund, and Morpheus Trading Group, a trader education firm launched in 2001 that provides daily technical analysis of the leading ETFs and stocks. For a free trial to the full version of The Wagner Daily or to learn about Wagner's other services, visit MorpheusTrading.com or send an e-mail to deron@morpheustrading.com.
|