| The Wagner Daily ETF Report for September 21 |
| By Deron Wagner |
Published
09/21/2007
|
Stocks
|
Unrated
|
|
|
|
The Wagner Daily ETF Report for September 21
The stock market corrected from its two-day surge yesterday, but the moderate pullback was orderly and controlled. The major indices opened near the flat line, then drifted slightly lower throughout the day. The S&P 500 fell 0.7%, the Nasdaq Composite 0.5%, and the Dow Jones Industrial Average 0.4%. The small-cap Russell 2000 and S&P Midcap 400 indices lost 0.9% and 0.7% respectively. All of the major indices closed in the bottom third of their intraday ranges.
After two straight days of accumulation, turnover eased across the board. Total volume in the NYSE receded 24%, while volume in the Nasdaq declined 18% below the previous day's level. Lighter volume on the first pullback that follows a strong breakout is exactly the type of price action bulls want to see. A higher volume "distribution day" would have canceled the bullish effect of Tuesday and Wednesday's instituitonal "accumulation days." In both the NYSE and Nasdaq, declining volume exceeded advancing volume by a margin of approximately 2 to 1, not overly negative.
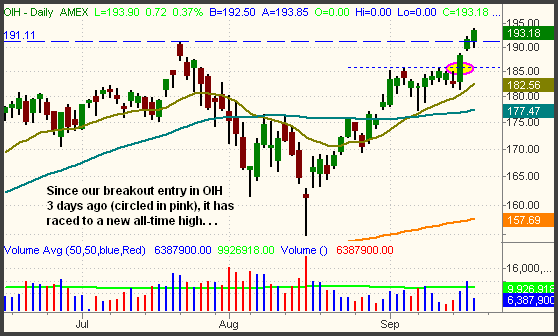
Mirroring the footsteps of the Oil Service Index ($OSX), the Oil Service HOLDR (OIH) firmly broke out to a new all-time high yesterday. The bullish consolidation that formed throughout the first half of September provided the fuel to quickly propel OIH to a new high:

Since our breakout entry just three days ago, OIH is already showing an unrealized gain of more than 7 points. Even though the gain is quite substantial, it has yet to give us a technical sell signal. Being that OIH has moved rather far above its 20-day MA, a large opening gap would give us a legitimate reason to sell into strength. But barring such action, we plan to continue trailing a stop higher to maximize profits, rather than trying to guess where the top may be.
In yesterday's Wagner Daily, we said that, "Over the next one to two weeks, the most positive thing the stock market could do is simply consolidate in a tight, sideways range. Such action would enable the 10 and 20-day moving averages to rise up to meet the current price and provide support. Further rally attempts without first having a period to digest recent gains will increase the risk of the gains being unsustainable." Therefore, despite the losses, yesterday's action was not really negative on a technical level. Leading stocks held up well, lower volume accompanied the pullback, and several of the major indices closed at short-term support levels.
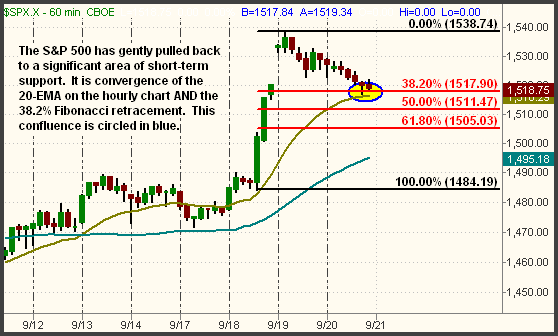
Over the past two days, the S&P 500 has gently drifted lower, off its high from the September 19 opening gap. This resulted in the index closing yesterday's session at convergence of two significant areas of near-term support. First, the S&P 500 has done a 38.2% Fibonacci retracement from the pre-Fed low up to the September 19 high. In strong trends, the 38.2% retracement often acts as the impetus to stimulate a resumption of the established trend. Further, the 38.2% retracement level also coincides with support of the 20-EMA on the hourly chart. Again, this moving average is a commonly used indicator that acts as support for buying pullbacks of strong trends. Support of the Fibonacci retracement and 20-EMA is shown on the hourly chart below:

As the major indices have been moving in sync with each other over the past several days, the Nasdaq Composite and Dow Jones Industrial Average both are exhibiting similar patterns as the S&P 500. This lack of bearish price divergence within the main indexes increases the chances of further upward momentum in the near-term.
Today is "quadruple witching" options expiration day, a session in which contracts for stock index futures, stock index options, stock options and single stock futures (SSF) all simultaneously expire. Occurring on the third Friday of the last calendar month of each quarter, "quadruple witching" often leads to erratic price movements in the market, especially late in the afternoon. This is caused by big institutional traders using their awesome buying power to push stocks toward their preferred settlement strike prices. As a rule, we try to avoid making decisions to enter new positions on options expiration days. The real underlying power of the rallies and selloffs tend to be exaggerated, the extent of which is often seen in the following Monday's trading action. Consider taking it easy today and just focusing on managing any open positions.
Open ETF positions:
Long - OIH, IBB, PBW, LQD
Short - (none)
Deron Wagner is the Founder and Head Trader of both Morpheus Capital LP, a U.S. hedge fund, and Morpheus Trading Group, a trader education firm launched in 2001 that provides daily technical analysis of the leading ETFs and stocks. For a free trial to the full version of The Wagner Daily or to learn about Wagner's other services, visit MorpheusTrading.com or send an e-mail to deron@morpheustrading.com.
|