|
The Wagner Daily ETF Report for September 19
A brazen half-point reduction in the federal funds rate launched a gargantuan rally that swept through practically every industry sector yesterday afternoon. The Fed surprised much of Wall Street by dropping the key rate 50 basis points instead of the widely anticipated 25 basis points. Further, they reduced the discount lending rate by another half-percent. The market's bullish reaction was immediate and swift, causing all of the main stock market indexes to gain at least 2.5%. The benchmark S&P 500 surged 2.9%, the Nasdaq Composite 2.7%, and the Dow Jones Industrial Average 2.5%. The small-cap Russell 2000 rocketed a tremendous 4.0%, while the S&P Midcap 400 ripped 3.0%. Impressively, each of the major indices finished at its intraday high.
Volume finally returned to the markets yesterday, as investors and traders took their cue from the Fed to jump back in the water. Total volume in the NYSE raced 48% above the previous day's level, as volume in the Nasdaq similarly increased 38%. The massive gains on substantially higher volume enabled both the S&P and Nasdaq to register the first confirmed "accumulation day" in weeks. Moreover, turnover in the NYSE finally returned to its 50-day average level for the first time in a month. Nasdaq volume remained below average, but was still the highest in more than four weeks. Market internals, especially in the NYSE, were in nosebleed territory. Advancing volume in the NYSE simply destroyed declining volume by a ridiculous margin of 29 to 1! The Nasdaq ratio was positive by nearly 10 to 1. The amazing adv/dec volume spread in the NYSE was clearly indicative of massive short covering. All the traders who had been short in anticipation of a resumption of the downward trend were forced to cover their positions when the major indices broke out in the afternoon. Nevertheless, we are not implying that all of yesterday's gains were just the result of short covering.
With nearly all the industry sectors on our watchlist scoring gains of 2% - 5%, it's fair to say that most ETFs acted quite well yesterday. However, some sector ETFs merely rallied into big resistance levels on their daily charts, while others broke out of important ranges. Below are five charts of ETFs that are now showing bullish chart patterns, two of which we bought yesterday. We'll begin with the Oil Service HOLDR (OIH):
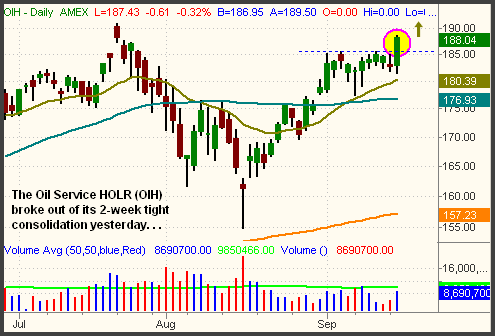
For the past week, we had been stalking OIH for a potential long entry, but it didn't break out of its consolidation until yesterday afternoon. One thing we particularly liked about the consolidation was the "fake-out" inverted hammer candlestick that formed on September 17. This bearish one-day pattern, followed by a dip below the September 17 low yesterday morning, undoubtedly shook out the "weak hands." Often, such action is required before a stock or ETF will break out of a base of consolidation, as it reduces the amount of overhead supply when the breakout attempt comes. We bought OIH at $185.79, when it moved above the high of its tight, two-week base of consolidation. Presently, the trade is showing an unrealized gain of just over 2 points, but we expect OIH to move to a new 52-week (and historical) high. We plan to trail a stop on the hourly chart in order to protect the gains, while maximizing profits.
Along with the rise in crude oil that helped push OIH above its range, the price of spot gold also zoomed higher after yesterday's Fed announcement. Finishing the regular session at just over $732 per ounce, the spot gold commodity closed at a new 52-week high. This, of course, enabled the StreetTRACKS Gold Trust (GLD) to close at a new 52-week high as well. As you can see on the weekly chart below, GLD is only about 50 cents away from breaking out to a fresh all-time high:
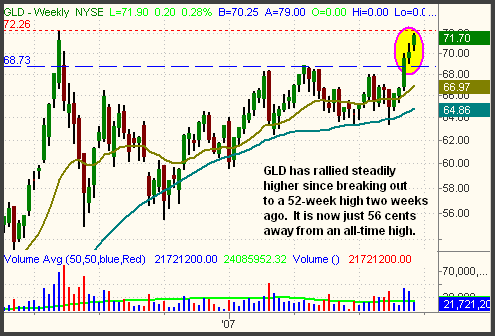
Despite its strength, GLD never provided us with a long entry that we felt comfortable with. We were on top of the breakout above its range two weeks ago, and waited for a decent pullback or correction by time. Unfortunately, it never even touched support of its 10-day moving average, which we use as a low-risk entry point for buying strong ETFs on a pullback or correction by time. Rather than chasing a trade in what was previously an indecisive market, we opted to pass it by. Still, GLD could form a handle for several weeks before breaking out to a new all-time high. If it does, the subsequent breakout above the range would be buyable.
The PowerShares Clean Energy (PBW), which we traded last month, just broke out above convergence of its intermediate-term downtrend line and 50-day MA:
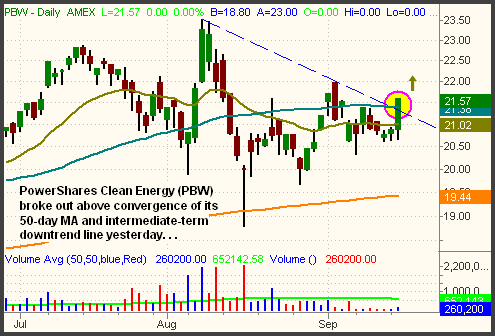
Many solar energy stocks, which comprise the bulk of the PBW portfolio, appear poised to resume their strong uptrends they have recently been taking a rest from. As they do, PBW should zoom higher alongside of them. When it first corrected from its August high, PBW became quite volatile and erratic. However, the range has tightened up considerably over the past two weeks. We bought PBW when it rallied above its convergence of resistance yesterday afternoon. Our target is a new high, so we again plan to trail a stop.
The Biotech Index ($BTK) gained 3.1% yesterday, pulling along related ETFs such as the Biotech HOLDR (BBH) and iShares Nasdaq Biotech (IBB). On its weekly chart, BBH has just broken out of an eight-month downtrend. It has also confirmed the breakout above its 200-day moving average, which it had been toying with for the past two weeks. The weekly chart of BBH is illustrated below:
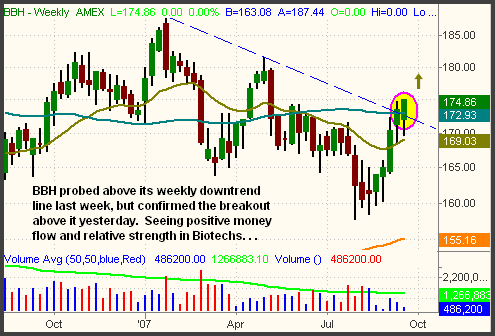
Though not positioned in BBH, we remain long a half position of IBB. We took profit on the first half of the position a week ago, before it pulled back, but stayed with the remaining shares. It now appears that IBB will quickly move above last week's high and towards our original price target of its 52-week high. We plan to sell the remaining shares into strength when/if it does.
Finally, the iPath India Total Return Index (INP) is an international ETF that caught our eye yesterday. Though the Chinese markets get all the attention, Indian stocks have been stealthily climbing higher as well. INP rocketed 4.5% and closed at a historical high yesterday. The breakout above the prior high is shown on the weekly chart below:
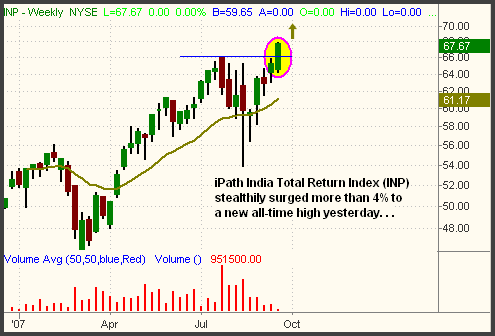
In July, we bought INP when it broke out above its prior consolidation, but locked in profits when it began testing support of its daily uptrend line a few weeks later. Since then, we've been watching the price action in INP, waiting for it to stabilize and move back to its prior highs. If INP pulls back to near support of its new breakout level (around $66 to $66.50), we will consider a long entry.
In yesterday's commentary, we said of the upcoming Fed meeting to "expect the subsequent market reaction to be even more wild than usual. This volatility will be further compounded by the fact that both the S&P and Dow have been stuck to their pivotal 50-day MAs for the past three days." This is indeed what happened, as huge volatility resulted from both the S&P and Dow cruising well above their 50-day moving averages yesterday. When the S&P and Dow moved above their recent highs, we stopped out of both the UltraShort S&P 500 ProShares (SDS) and UltraShort Dow 30 ProShares (DXD). We sustained losses in both positions, but they were nevertheless showing good risk/reward ratios at the time of entry. Further, we managed the positions in such a way as to avoid panic selling when the surprise announcement hit the markets yesterday.
As we often do, we canceled our mechanical stop orders on open positions minutes before the Fed announcement. This did NOT mean we intended to ignore the stops. Rather, we just didn't want to get whipsawed from a violent knee-jerk reaction that often goes nowhere. Literally seconds after the 2:15 pm ET rate cut announcement, both the S&P and Dow Industrials catapulted higher with a ferocious tenacity. This, of course, had the opposite effect on our SDS and DXD positions, both of which collapsed below their stop prices in the blink of an eye.
On the rare occasions when this happens, we've learned that immediately hitting the panic button usually results in much lower sell prices than calmly waiting for the first small bounce to sell into strength. The idea is not to wait for a full reversal back to the prior prices, as that's only wishful thinking, but simply to wait for a normal intraday bounce. When micromanaging an intraday exit on a position, we like to use the 20-period exponential moving average on the 2-minute chart. In strong intraday trends, bounces off that level often result in a resumption of the primary trend. In this case, we waited for both SDS and DXD to approach their 20-EMAs on the 2-minute charts before closing the positions. This enabled us to get out near the top of the first bounce. Yesterday's 2-minute chart of SDS is shown below:
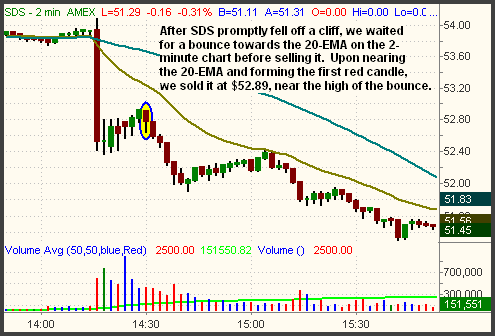
Because the downtrend in SDS was so strong, it reversed lower before actually touching its 20-MA. However, we sold SDS when it formed the first red candle, as it neared the 20-EMA. This got us out within a few cents of the top of the bounce AND only about 30 cents below our original stop price. The same goes for DXD. Often, waiting for such a bounce on a position that hits your stop will enable you to get out at a better price than the original stop. The important point, though, is not to fall into "hope" mode and get greedy during the bounce. The objective is merely to make the best of a losing position.
Today, it is reasonable to expect a bit of sideways action as stocks digest yesterday's gains, but our overall market bias has definitively shifted to bullish in the short-term. As for the intermediate-term, we are neutral until we see how the major indices react to the probable test of their 52-week highs in the coming weeks. We have no comment on the longer-term implications of yesterday's aggressive Fed move, but it will be interesting to see whether or not the stock market truly views a half-point rate cut as positive, after the initial excitement fades.
Open ETF positions:
Long - IBB, OIH, PBW, LQD
Short - (none)
Deron Wagner is the Founder and Head Trader of both Morpheus Capital LP, a U.S. hedge fund, and Morpheus Trading Group, a trader education firm launched in 2001 that provides daily technical analysis of the leading ETFs and stocks. For a free trial to the full version of The Wagner Daily or to learn about Wagner's other services, visit MorpheusTrading.com or send an e-mail to deron@morpheustrading.com.
|