| Gold (GLD), Newmont Mining (NEM) Rising out of Double Bottom |
| By Mike Paulenoff |
Published
08/28/2007
|
Futures , Stocks
|
Unrated
|
|
|
|
Gold (GLD), Newmont Mining (NEM) Rising out of Double Bottom
Instead of reviewing spot gold, or the streetTRACKS Gold Shares (NYSE: GLD) today, let's have a look at Newmont Mining (NYSE: NEM), which is the second largest component of the GDX (Market Vectors Gold Mining ETF).
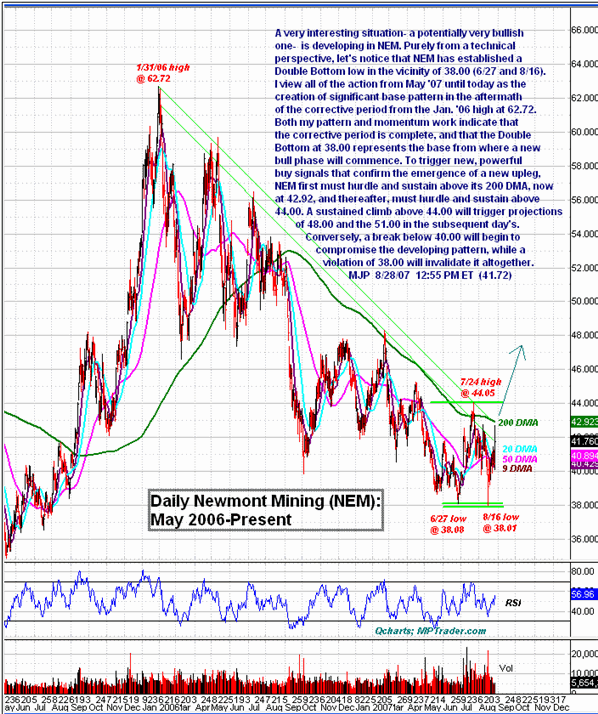
A very interesting situation, and potentially very bullish one, is developing in NEM. Purely from a technical perspective, let's notice that NEM has established a double bottom low in the vicinity of 38 (from June 27 and August 26). I view all of the action from May 2007 until today as the creation of a significant base pattern in the aftermath of the corrective period from the January 2006 high at 62.72. Both my pattern and momentum work indicate that the corrective period is complete and that the double bottom at 38 represents the base from where a new bull phase will commence. To trigger new, powerful buy signals that confirm the emergence of a new upleg, NEM first must hurdle and sustain above its 200 DMA, now at 42.92, and thereafter much hurdle and sustain above 44. A sustained climb above 44 will trigger projections of 48 and then 51 in the subsequent days. Conversely, a break below 40 will begin to compromise the developing pattern, while a violation of 38 will invalidate it altogether.
Mike Paulenoff is a 26-year veteran of the financial markets and author of MPTrader.com, a real-time diary of his technical chart analysis and trading alerts on all major markets. For more of Mike Paulenoff, sign up for a free 15-Day trial to his MPTrader Diary by clicking here.
|


 Free Festival of Traders Videos