| Sometimes a Little Logic Goes a Long Way |
| By Todd Gordon |
Published
07/11/2007
|
Currency
|
Unrated
|
|
|
|
Sometimes a Little Logic Goes a Long Way
Well, I'm glad I relied on my logic rather than my chart analysis, because the 122.20 USD/JPY shorts are having a rough start to their evening, or their morning, depending on location. I'm going to leave USD/JPY alone while contained within 121-123 for now because, frankly, I feel like I'll get my head taken off in there if I don't.
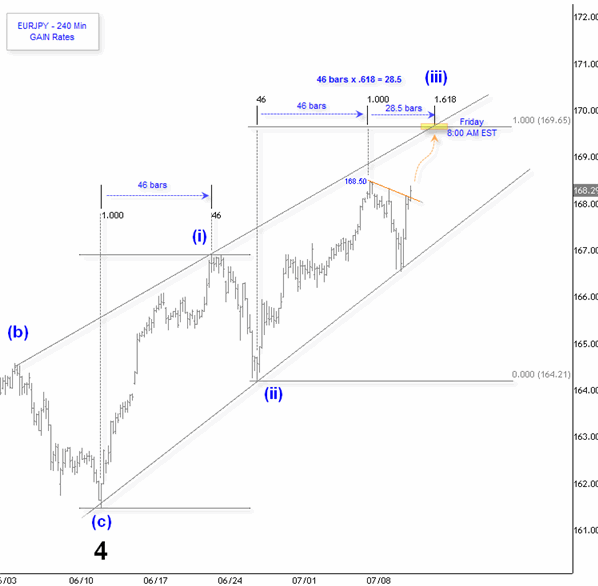
EUR/JPY remained surprisingly resilient while USD/JPY was getting thrashed, and then once USD/JPY bottomed out last night, EUR/JPY took it as a signal to head right back to the highs. We have broken minor downtrend resistance (shown in orange) as the 122.20 USD/JPY shorts were squeezed this afternoon, so for tonight we're going with it. I am long from 168.17 with stops at 167.95, and an initial take profit and stop move to cost at 168.62.
And now it's time for that voodoo that I do. For the last piece of EUR/JPY, I am going to target 169.65 at 8:00 a.m. ET Friday morning. How do I get 8:00 a.m. Friday morning? Well, if you take the total time elapsed in wave (i), 46 bars, and then project that forward from the beginning of wave (iii), you arrive at the exact, intermediate high of 168.50. Obviously, this falls within the 169.65 measured objective of wave (iii), so we must look to the next time projection based on the 46-bar wave (i). So, if you multiply 46 by 1.618, the golden ratio, you arrive at 74.42 bars, or 8:00 a.m. ET Friday morning. Notice the trendline resistance and 169.65 measured objective that coincides with price at this exact hour. Coincidence? I think not. There is a natural, underlying order in the market that can be uncovered, if you know what to look for.
Todd Gordon is a Technical Currency Strategist and Fund Trader with GAIN Capital Group.
Disclaimer
The information and opinions in this report are for general information use only and are not intended as an offer or solicitation with respect to the purchase or sale of any currency. All opinions and information contained in this report are subject to change without notice. This report has been prepared without regard to the specific investment objectives, financial situation and needs of any particular recipient. While the information contained herein was obtained from sources believed to be reliable, author does not guarantee its accuracy or completeness, nor does author assume any liability for any direct, indirect or consequential loss that may result from the reliance by any person upon any such information or opinions.
|


 Free Festival of Traders Videos