| Symmetrical Triangle Time Limit Resolution |
| By Andy Swan |
Published
05/2/2007
|
Stocks
|
Unrated
|
|
|
|
Symmetrical Triangle Time Limit Resolution
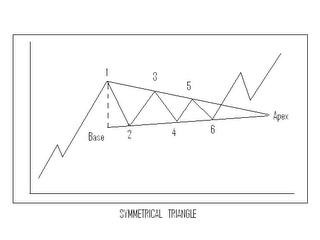
A symmetrical triangle has a time limit, which is the point where the two lines intersect forming the apex. The general rule is prices will breakout in the direction of the prior trend usually between tw0-thirds and three-quarters of the horizontal width of the triangle. The horizontal width is the distance from the vertical base on the left to the apex on the right. Knowing the two lines will meet, the time distance can be measured once the two converging lines are drawn. See the graph below. Note an upside breakout is signaled by the penetration of the upper trendline. If prices fail to breakout of the triangle by the three-quarter mark, the triangle loses potency and prices will, usually, then continue on out the apex and beyond.
The symmetrical triangle provides a combination of time and price. The converging trendlines set a price boundary and indicate at which point this pricing pattern will be completed by the penetration of the trendline. The upper line in the case of an uptrend, and the lower line in the case of a downtrend. However, the trendlines also give us a time target when we measure the horizontal width. For example, if the width ran 20 weeks, the the expected breakout point would be 13 (two-thirds) to 15 (three-quarters) weeks.
The actual trend signal occurs with a closing penetration of one of the trendlines, with an occasional return move back to the penetrated line after breakout. In an uptrend, the line that is broken becomes the support level. In a downtrend, the penetrated line becomes resistance. The apex will also becomes an important support and resistance level after a breakout.
Andy Swan is co-founder and head trader for DaytradeTeam.com. To get all of Andy's day trading, swing trading, and options trading alerts in real time, subscribe to a one-week, all-inclusive trial membership to DaytradeTeam by clicking here.
|


 Free Festival of Traders Videos