| Oracle (ORCL) Chart Foretells Continued Downside Pressure |
| By Mike Paulenoff |
Published
02/7/2007
|
Stocks
|
Unrated
|
|
|
|
Oracle (ORCL) Chart Foretells Continued Downside Pressure
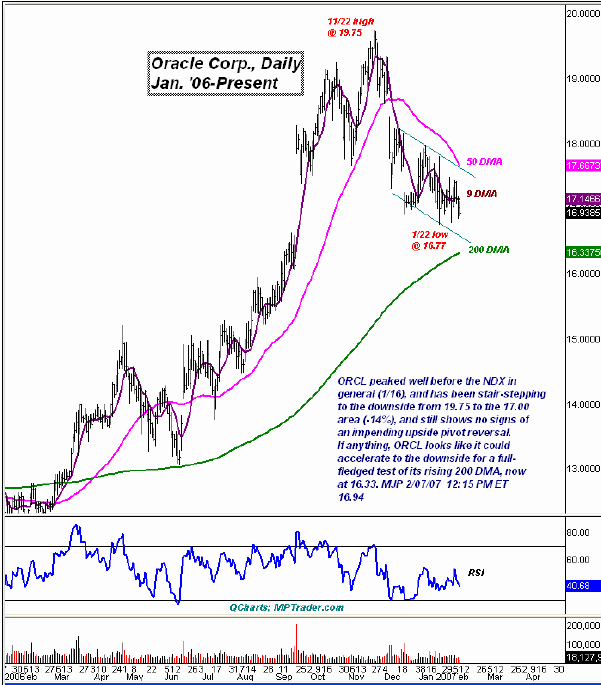
Oracle Corp. (ORCL) peaked well before the NDX in general (January 16), and has been stair-stepping to the downside from 19.75 to the 17 area (-14%), and still shows no signs of an impending upside pivot reversal. If anything, ORCL looks like it could accelerate to the downside for a full-fledged test of is rising 200-day MA, now at 16.33.

Mike Paulenoff is a 26-year veteran of the financial markets and author of MPTrader.com, a real-time diary of his technical chart analysis and trading alerts on all major markets. For more of Mike Paulenoff, sign up for a free 15-Day trial to his MPTrader Diary by clicking here.
|