My sense from Friday's intraday technical action is that the major equity market ETF's still have some additional upside recovery grinding to do on Monday prior to another bout of weakness.
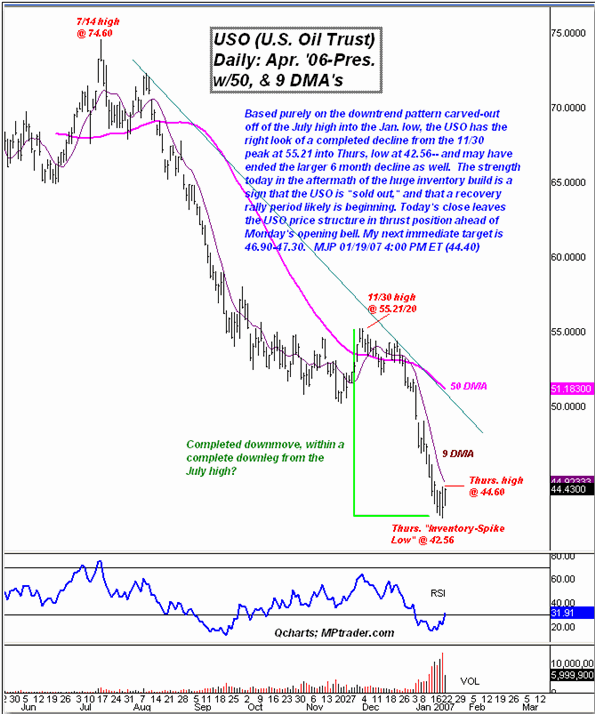
In the meantime, my chart work argues that crude oil prices and the US Oil Fund (USO) ETF are nearing, or are in, a turn to the upside that will trigger a significant recovery rally period in the energy complex.
Based purely on the downtrend pattern carved-out off of the July high into the January low, the USO has the right look of a completed decline from the 11/30 peak at 55.21 into Thursday’s low at 42.56 – and may have ended the larger 6-month decline as well.
The strength today in the aftermath of the huge inventory build is a sign that the USO is sold out, and that a recovery rally period likely is beginning. Today’s close leaves the USO price structure in thrust position ahead of Monday’s opening bell. My next intermediate target is 46.90-47.30.

Gold is also looking bullish. Spot Gold prices are up nearly $8 at $636, considerably above the Jan. low near $601, and poised to thrust above key resistance. The streetTRACKS Gold Shares (GLD) ETF acts similarly.
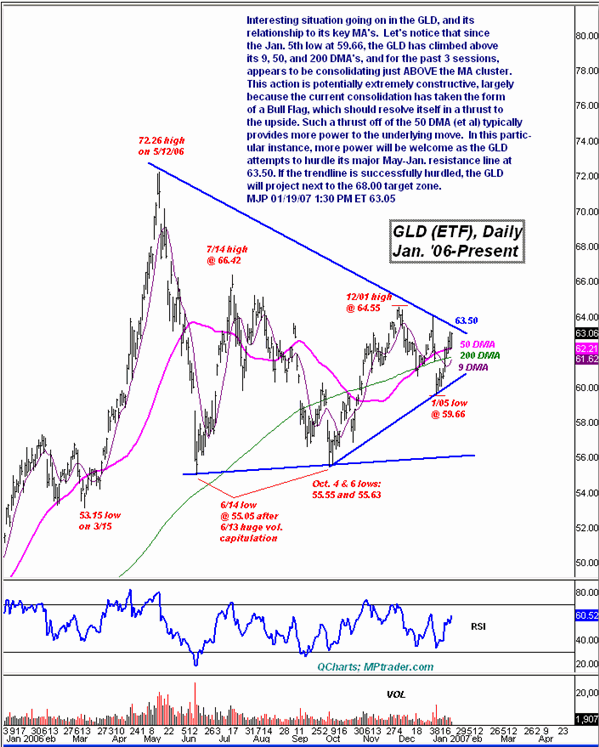
Let’s notice that since the January 5 low at 59.66, the GLD has climbed above its 9, 50 and 200 DMAs, and for the past three sessions appears to be consolidating just above the moving average cluster. This action is potentially extremely constructive, largely because the current consolidation has taken the form of a Bull Flag, which should resolve itself in a thrust to the upside. Such a thrust off of the 50 DMA (et al) typically provides more power to the underlying move. In this particular instance, more power will be welcome as the GLD attempts to hurdle its major May-January resistance line at 63.50. If the trendline is successfully hurdled, the GLD will project next to the 68 target zone.

Mike Paulenoff is a 26-year veteran of the financial markets and author of MPTrader.com, a real-time diary of his technical chart analysis and trading alerts on all major markets. For more of Mike Paulenoff, sign up for a free 15-Day trial to his MPTrader Diary by clicking here.