The weekly chart of the S&P 500 (SPX), which has closed right at the high, shows the upside reversal week weââ,¬â"˘ve had. Although the SPX is about $1.20 off of the 12/18 high, the fact that it reversed with such power this week argues strongly that a new upleg started on Wednesday, as the index pivoted out of its sharply rising 10-week moving average, and which points to a next target in the 1460 area. From this moment on, critical support rests at this weekââ,¬â"˘s low of 1403.97.
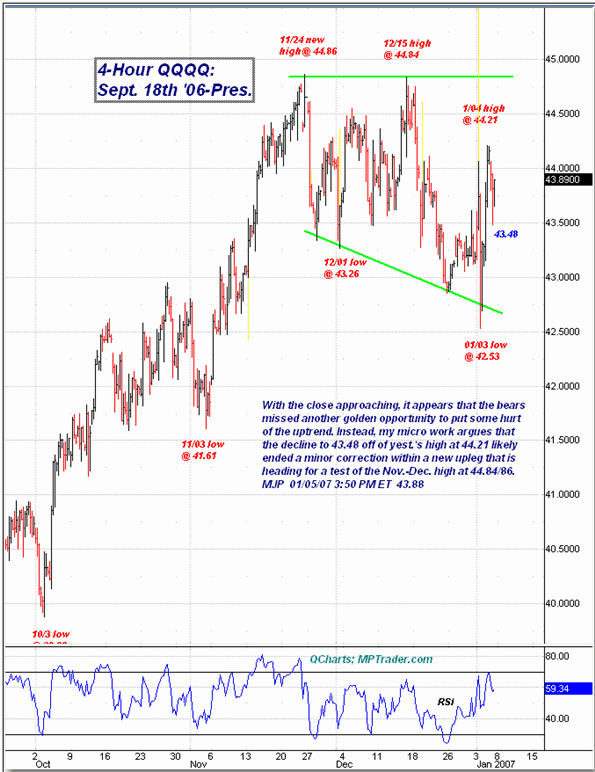
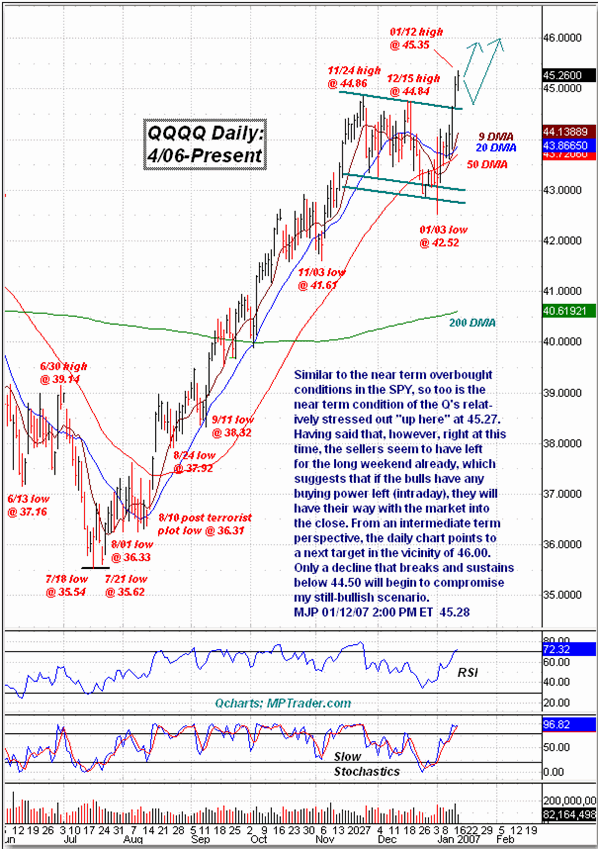
Similar to the near-term overbought conditions in the S&P 500 and its ETF, the SPDRs (SPY), so too is the near-term condition of the Nasdaq 100 and its tracking stock, the QQQQ, relatively stressed out ââ,¬Ĺ"up hereââ,¬Âť at 45.27. From an intermediate-term perspective, the daily chart points to a next target in the vicinity of 46. Only a decline that breaks and sustains below 44.50 will begin to compromise my still-bullish scenario.
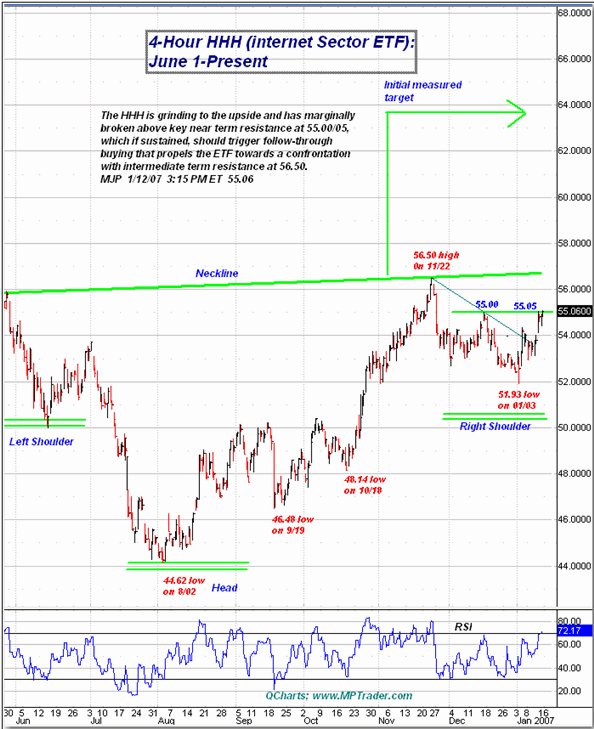
Also pushing higher are Internet stocks, as represented by the HHH (Internet HLDRs) ETF. The HHH is grinding to the upside and has marginally broken above key near-term resistance at 55.00/05, which if sustained should trigger follow-through buying that propels the ETF towards a confrontation with intermediate-term resistance at 56.50.


Mike Paulenoff is a 26-year veteran of the financial markets and author of MPTrader.com, a real-time diary of his technical chart analysis and trading alerts on all major markets. For more of Mike Paulenoff, sign up for a free 15-Day trial to his MPTrader Diary by clicking here.