Will stocks pick up in 2007 where they left off in 2006? Nobody really knows, but we have to assume they will -- at least on a sector and industry basis. With that in mind, here are the latest developments we see in motion.
As usual, any stocks that may benefit from the gift-giving season (specialty and apparel retailers, electronics, toys, etc.) seem to have already been through the bottom-then-top well in advance of any actual announced results. In other words, investors seem to have assumed shopping was strong enough to buy these stocks before any final word was given about the strength of the shopping season.
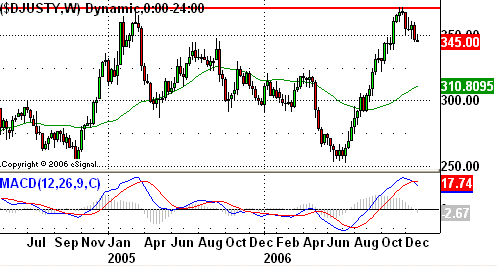
Case in point is toy makers. Between July 7 and November 24, the Dow Jones Toy Index (DJUSTY) ran up by 43%. That's fantastic, but the baffling part is how the toy-shopping part of the season doesn't actually start until after Thanksgiving. Since that point in time, the index has fallen 6.2%. The point is, this industry chart may confirm that "buying the rumor/selling the news" is the way to trade the seasonal trend. Nobody really knew for sure in July how things would turn out in December. Yet, this group rallied sharply.
What's that got to do with now? Although Christmas sales are expected to be strong - according to initial reports - the current chart says the gains for investors may be a thing of the past. Seeing a fairly precise double-top around 370 was and is a red flag, but the downtrend would be clear even without it. With no real floor in sight, we're going to set a bearish target of 311. That's where the 200-day moving average line is now; it's historically been a meaningful landing point. The stop on the bullish bias comes at 360.
Dow Jones Toy Index (DJUSTY) - Weekly Chart

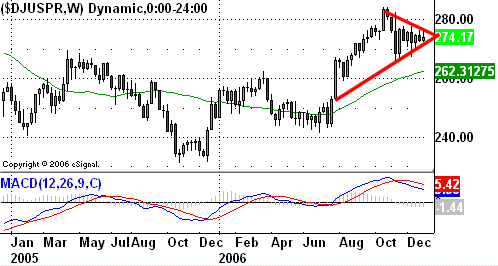
Pharmaceutical stocks seem to be at a critical juncture, at least according to a classic technical analysis pattern. The shape is called a wedge or a pennant, framed in red on our chart below.
Some pennants are further described as 'rising' if the lower edge is rising and the upper edge is flat (an ascending triangle). Or, they maybe categorized as 'falling' if the upper edge is sloped downward while the lower edge is horizontal (a descending triangle). In general, the former is bullish while the latter is bearish, although there are always exceptions.
But what does it mean when the wedge is symmetrical (the upward slope is a mirror image of the downward slope)? These triangles show a lot of indecision. However, they're still worth noting, because they also often occur right before a major move -- once one side of the triangle breaks.
Is there a way to gauge which direction the breakout is likely to occur? Barely. Slightly more often than not, there's a continuation of the trend that was in place before the wedge began to form. However, there are two challenges that theory presents right now for the Dow Jones Pharmaceutical Index (DJUSPR). The first is, it's still something of a coin toss, and second, it's not exactly clear whether or not the 'prior' trend was a bullish on or bearish one. The group was collectively rising between August and October, but we saw a nasty bearish move in late October and early November. That November move might be a new trend, or it might just be part of the wedge pattern.
In any case, we think this triangle is setting up some volatility soon, so we're going to be watching closely for one side of it to break. Once it does, it could make for a nice trade.
Dow Jones Pharmaceutical Index (DJUSPR) - Weekly Chart

Although they've been bullish for most of the year, auto manufacturer stocks suffered a major setback between November and December, falling 13.7% in just four weeks. While some pundits thought that might be the beginning of the end fore what was already an errant rally, we want to point out that the Dow Jones Automobile Index (DJUSAU) has actually been on the rise the last couple of weeks. Since December 15th, these stocks have collectively gained 3.8%, which tops the S&P 500's loss of 0.6% during the same time span. So, we're not counting these stocks our just yet -- far from it. We still see a lot of upside potential. In fact, we can still see a revisit to all-time highs above 400 for this index - if given enough time. In the meantime, the short-term target is November's high of 214.
We'll set a stop of 181 for the Dow Jones Automobile Index; that's where we bottomed a couple of weeks ago.
Dow Jones Automobile Index (DJUSAU) - Weekly Chart

Price Headley is the founder and chief analyst of BigTrends.com.