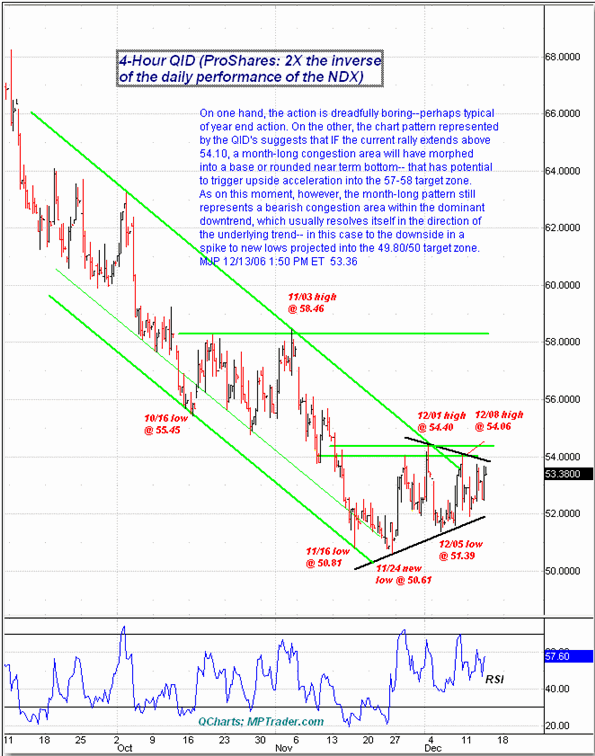
On one hand, today's stock market action is dreadfully boring ââ,¬â€ś- perhaps typical of year-end action. On the other, the chart pattern represented by the QIDs (ProShares: 2x the inverse performance of the NDX) suggests that if the current rally extends above 54.10, a month-long congestion area will have morphed into a base or rounded near-term bottom that has potential to trigger upside acceleration into the 57-58 target zone.
As of this moment, however, the month-long pattern still represents a bearish congestion area within the dominant downtrend, which usually resolves itself in the direction of the underlying trend ââ,¬â€ś in this case to the downside in a spike to new lows projected into the 49.80/50 target zone.


Mike Paulenoff is a 26-year veteran of the financial markets and author of MPTrader.com, a real-time diary of his technical chart analysis and trading alerts on all major markets. For more of Mike Paulenoff, sign up for a free 15-Day trial to his MPTrader Diary by clicking here.