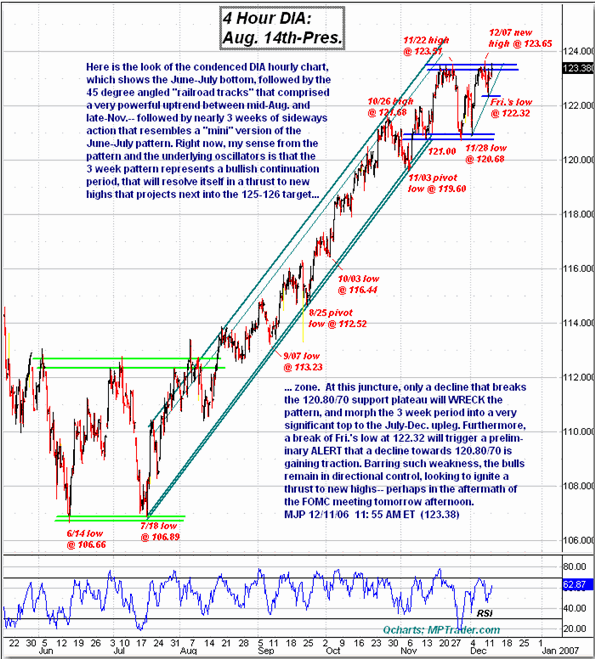
Here is a look of the condensed DIA hourly chart, which shows the June-July bottom, followed by the 45-degree angled ââ,¬Ĺ"railroad tracksââ,¬Âť that comprised a very powerful uptrend between mid-August and late-November -- followed by nearly 3 weeks of sideways action that resembles a ââ,¬Ĺ"miniââ,¬Âť version of the June-July pattern.
Right now, my sense from the pattern and the underlying oscillators is that the 3-week pattern represents a bullish continuation period, that will resolve itself in a thrust to new highs that projects next into the 125-126 target zone. At this juncture, only a decline that breaks the 120.80/70 support plateau will wreck the pattern and morph the 3-week period into a very significant top to the July-December upleg.

Furthermore, a break of Fridayââ,¬â"˘s low at 122.32 will trigger a preliminary alert that a decline towards 120.80/70 is gaining traction. Barring such weakness, the bulls remain in directional control, looking to ignite a thrust to new highs -- perhaps in the aftermath of the FOMC meeting tomorrow afternoon.
Mike Paulenoff is a 26-year veteran of the financial markets and author of MPTrader.com, a real-time diary of his technical chart analysis and trading alerts on all major markets. For more of Mike Paulenoff, sign up for a free 15-Day trial to his MPTrader Diary by clicking here.


 Free Festival of Traders Videos