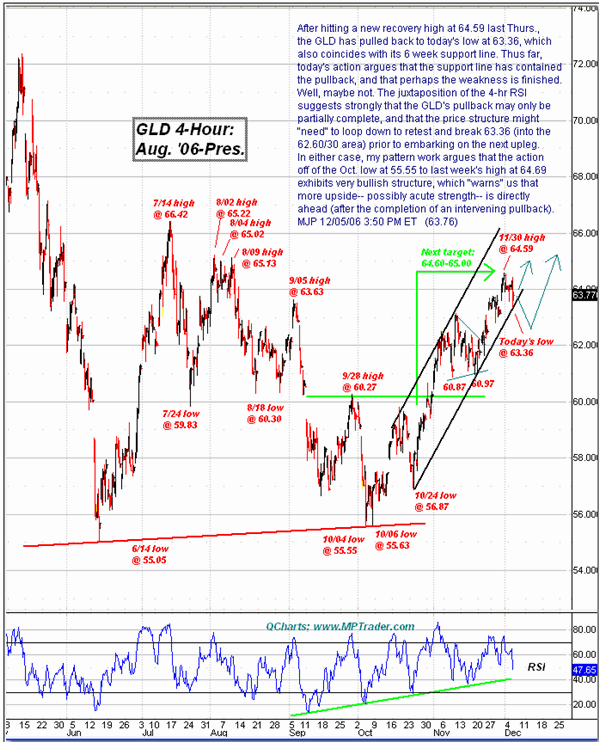
After hitting a new recovery high at 64.59 last Thursday, the GLD has pulled back to today's low at 63.36, which also coincides with its 6-week support line. Thus far, today's action argues that the support line has contained the pullback, and that perhaps the weakness is finished. Well, maybe not. The juxtaposition of the 4-hour RSI suggests strongly that the GLD's pullback may only be partially complete, and that the price structure might need to loop down to retest and break 63.36 (into the 62.60/30 area) prior to embarking on the next upleg. In either case, my pattern work argues that the action off of the October low at 55.55 to last week's high at 64.69 exhibits very bullish structure, which warns us that more upside, possibly acute strength, is directly ahead (after the completion of an intervening pullback).

Mike Paulenoff is a 26-year veteran of the financial markets and author of MPTrader.com, a real-time diary of his technical chart analysis and trading alerts on all major markets. For more of Mike Paulenoff, sign up for a free 15-Day trial to his MPTrader Diary by clicking here.