Good morning! The market had a rough session on Friday with a lot of choppy action on the smaller time frames and strong selling throughout the morning. We saw the market react poorly to Thursday's 10:00 ET economic data, and that was magnified several-fold on Friday with its data. The Institute of Supply Management's index fell to 49.4% in November, down from 51.2% in October. It had been expected to expand to 51.8%, so this indicated a contraction in the manufacturing sector last month, mirroring the slowdown seen in business in the Chicago area that had been reported the day before. Typically the Fed will cut interest rates if the ISM falls under 50.

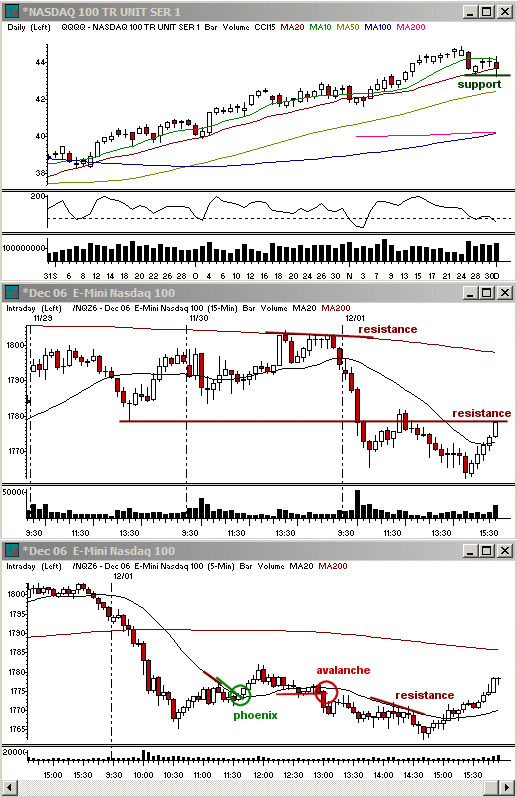
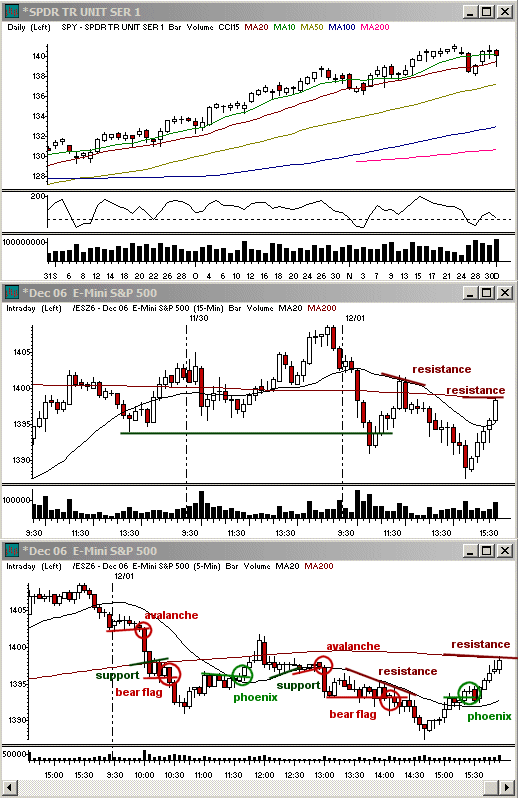
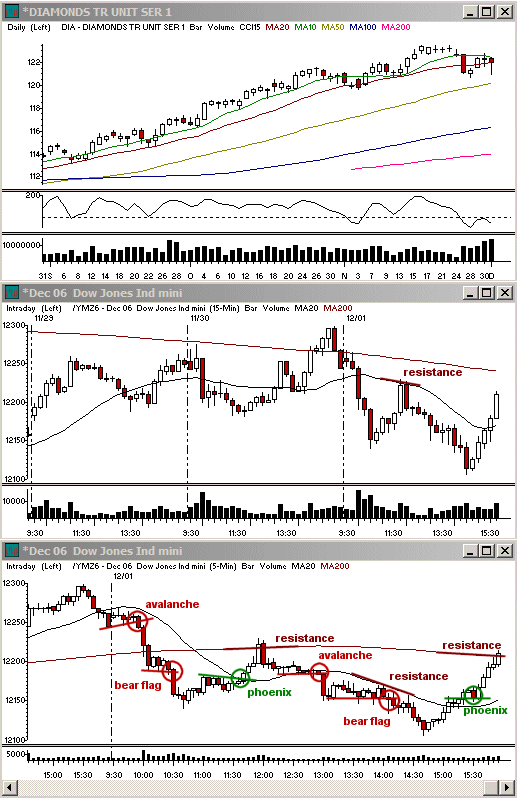
The follow-through on the ISM data was very swift. A second wave of selling took the indices past Thursday's lows and led to the Nasdaq Composite testing its lows on the week before the market finally corrected to the selling heading into lunch. The market often corrects within a trend with two waves of smaller movement in the opposite direction. The first one took the indices into the 5 minute 20 simple moving average. A second wave of correction off lows broke that resistance and brought the S&P 500 and Dow Jones Industrial Average into their 15 minute 20 simple moving averages. The Nasdaq had a more difficult time recovering after it had experienced stronger relative weakness in the morning selling. All three indices stalled their mid-day move with the 12:00 ET reversal period as the resistance levels were hitting, but there was a great deal of hesitation as the bears once again returned to the front.

The market sold off for the next couple of hours, sliding lower at the same pace as the 20 period simple moving average on the 15 minute charts. It made the risk of a stronger correction a lot higher, but we never really saw any significant change in pace once the lows did hit shortly after 14:30 ET. The market moved into that low with just an average-paced move and lacked a strong volume surge on the larger time frames. The pivot didn't even have a reversal period in its favor when it occurred. It just reversed with another average-paced move and then continued after a choppy stall in the buying at the prior 5 minute congestion and 20 sma zone. This reversal was fairly significant in terms of price, however, since the result was that the Dow managed to only loose 27.80 points, or 0.2%, on the day. The S&P 500 performed a bit more poorly, falling 3.92 points, or 0.3%, on the day. The Nasdaq, which had the strongest morning decline as the technology sector gave way to heavy selling, lost the most on the day, dropping 18.56 points, or 0.8%.

As we head into the new week, the daily range we have been following the past couple of days is looking to continue early into this week since there has been more than a 50% retracement off the lows of the 28th into the 30th and then another move back that was greater than 50% of the prior rally. We will want to watch for a slow down in the momentum off either the upper or lower trading range and for the range to begin to favor one end over this other. If it reacts less to the lower end of the range, both in terms of the momentum off the lows, as well as holding the lower end of the trading range, then we should see more of a correction on the weekly charts with a break of the 50 day simple moving average support. If the opposite occurs, then we are likely to see more of a repeat of the end of last year. On the upside I will be watching SYK, EZPW and ALV on the daily charts.
Economic Reports and Events This Week
Monday: -
Tuesday: Productivity-Rev. for Q3 (8:30 am), Factory Orders for Oct. (10:00 am), ISM Services for Nov. (10:00 am)
Wednesday: Crude Inventories 12/01 (10:30 am)
Thursday: Initial Claims 12/02 (8:30 am), Consumer Credit for Oct. (3:00 pm)
Friday: Average Workweek, Hourly Earnings, Nonfarm Payrolls, and Unemployment Rate for Nov. (8:30 am), Mich. Sentiment-Prel. for Dec. (10:00 am)
Key Earnings Announcements This Week
Monday: NRGY, IMKTA, CMTL, CNQR, and PLL
Tuesday: AZO, KR, SAFM, TOL, WWE, AGIL, CPRT, NOVL, and PLAB
Wednesday: KFY, TWTR, NX, CWST, DDMX, GEF, LQDT, NCS, SEAC, UTI, and VTS
Thursday: CRMT, CBUK, FLE, GIL, HITK, JJZ, JOSB, METH, MOV, PTMK, TOPT, TTC, ATW, CENT, SMOS, DMND, ESL, NSM, SHFL, and PAY
Friday: BKRS
Note: All economic numbers and earnings reports are in lines with those compiled by Yahoo Finance and Briefing.com. Occasionally changes will occur that are made after the posting of this column.
Toni Hansen is President and Co-founder of the Bastiat Group, Inc., and runs the popular Trading From Main Street. She can be reached at Toni@tradingfrommainstreet.com.