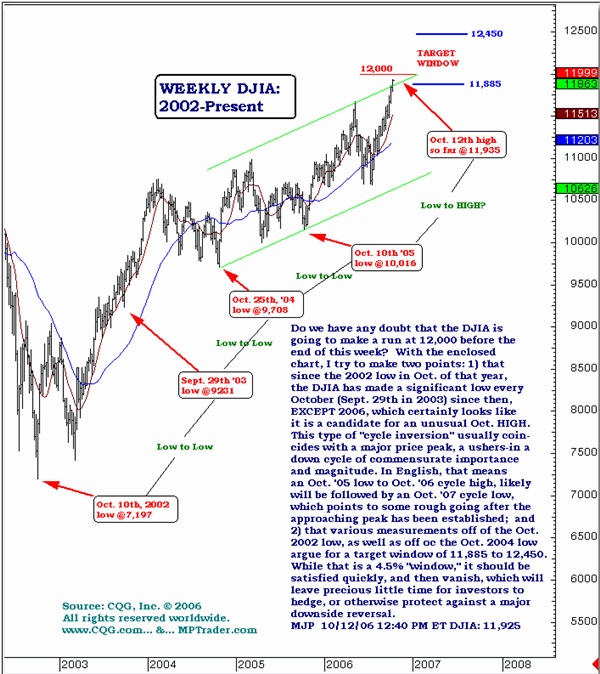
Do I have any doubt that the DJIA is going to make a run at 12,000 before the end of this week? With the enclosed chart, I try to make two points: 1) that since the 2002 low in October of that year, the DJIA has made a significant low every October (September 29 in 2003) since then, except 2006, which certainly looks like it is a candidate for an unusual October high. This type of "cycle inversion" usually coin- cides with a major price peak, a ushers-in a down cycle of commensurate importance and magnitude. In English, that means an October 2005 low to October 2006 cycle high, likely will be followed by an October 2007 cycle low, which points to some rough going after the approaching peak has been established; and 2) that various measurements off of the October 2002 low, as well as off of the October 2004 low argue for a target window of 11,885 to 12,450. While that is a 4.5% "window," it should be satisfied quickly, and then vanish, which will leave precious little time for investors to hedge, or otherwise protect against a major downside reversal.

Mike Paulenoff is a 26-year veteran of the financial markets and author of MPTrader.com, a real-time diary of his technical chart analysis and trading alerts on all major markets. For more of Mike Paulenoff, sign up for a free 15-Day trial to his MPTrader Diary by clicking here.