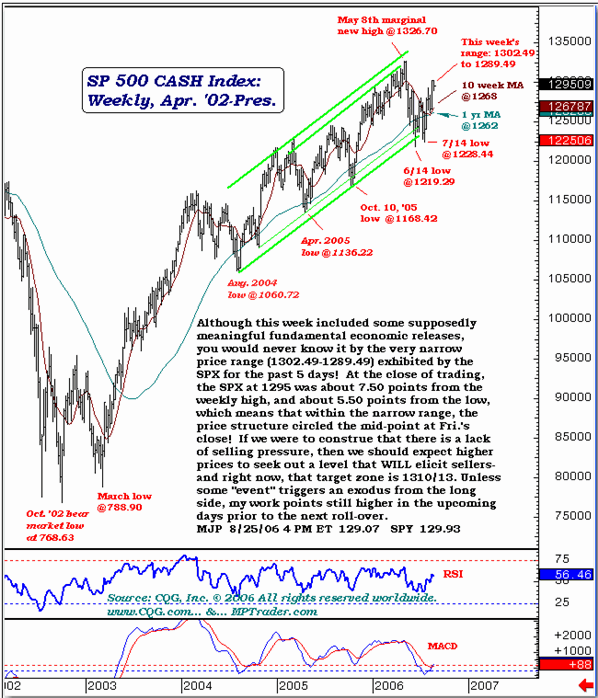
Although the trading day before Labor Day is not the most opportune time to expect price weakness (or to be short), my work argues nonetheless that the July-August advance in the S&P 500 is very close to completion.
Let's notice that yesterday's high in the S&P 500 SPDRs (SPY) at 131.04 was not confirmed by my daily RSI momentum gauge (the RSI made its high on 8/18), which is a preliminary warning signal that the current advance is running out of gas. In addition, let's also notice that the volume of SPY trading since its upside breakout on 8/16 shows a decided lack of enthusiasm, rather than a much more bullish expansion.
This also serves as a warning signal that the May-August pattern represents a recovery rally period (that is nearing completion) rather than a big base formation that has the power to thrust the SPY to new 2006 highs. If tomorrow were not the day before the Labor Day weekend, and an Employment Report Friday, I would be getting into a partial short position.
Under the circumstances, however, prudence dictates that we wait a while longer before establishing short positions.

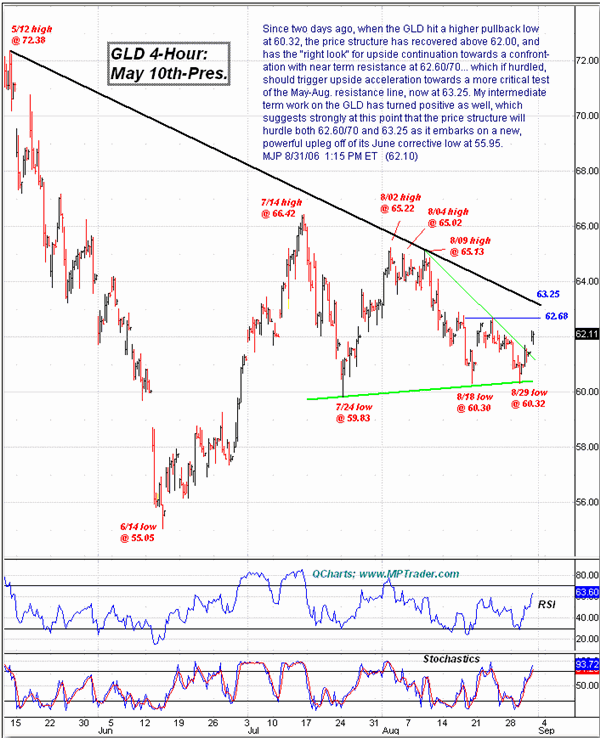
Looking at gold, since two days ago, when the gold ETF -- the streetTRACKS Gold Shares (GLD) -- hit a higher pullback low at 60.32, the price structure has recovered above 62.00 and has the ââ,¬Ĺ"right lookââ,¬Âť for upside continuation towards a confrontation with near-term resistance at 62.60/70. If hurdled, that should trigger upside acceleration towards a more critical test of the May-August resistance line, now at 63.25.
My intermediate-term work on the GLD has turned positive as well, which suggests strongly at this point that the price structure will hurdle both 62.60/70 and 63.25 as it embarks on a new powerful upleg off of its June corrective low at 55.95.

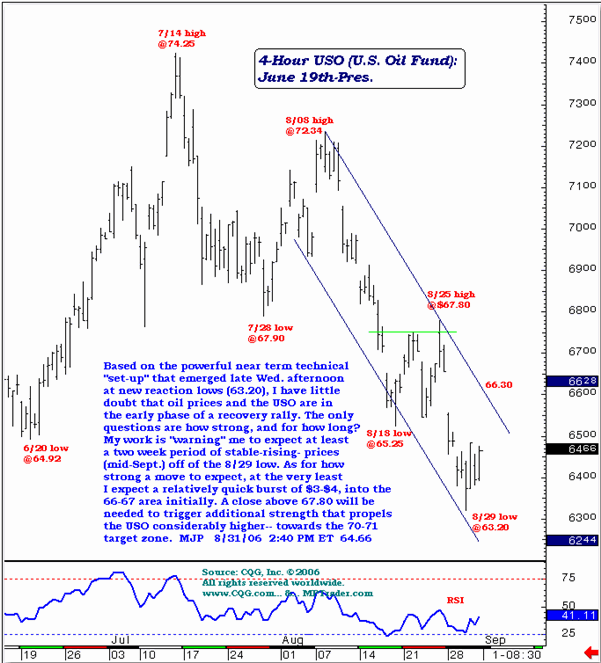
Similarly, oil prices may be seeing an upturn. Based on the powerful near-term technical ââ,¬Ĺ"set-upââ,¬Âť that emerged late Wednesday afternoon at new reaction lows of 63.20, I have little doubt that oil prices and the U.S. Oil Fund ETF (USO) are in the early phase of a recovery rally.
The only questions are how strong and for how long? My work is warning me to expect at least a two-week period of stable, rising prices into mid-September off of the August 29 low.
As for how strong a move to expect, at the very least I expect a relatively quick burst of $3-$4 into the 66-67 area initially. A close above 67.80 will be needed to trigger additional strength that propels the USO considerably higher ââ,¬â€ś towards the 70-71 target zone.

Mike Paulenoff is a 26-year veteran of the financial markets and author of MPTrader.com, a real-time diary of his technical chart analysis and trading alerts on all major markets. For more of Mike Paulenoff, sign up for a free 15-Day trial to his MPTrader Diary by clicking here.