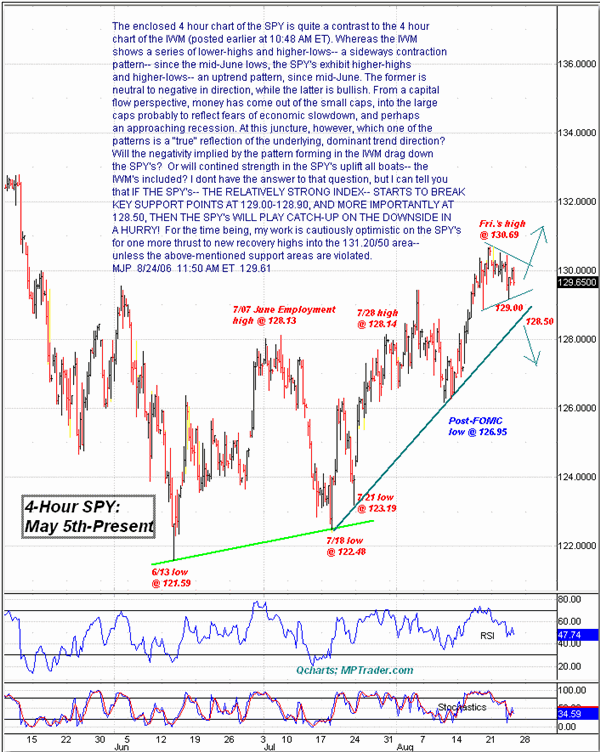
Whereas the Russell 2000 ETF (IWM) shows a series of lower highs and higher lows ââ,¬â€ś a sideways contraction pattern ââ,¬â€ś since the mid-June lows, the SPYââ,¬â"˘s exhibit higher highs and higher lows ââ,¬â€ś an uptrend pattern. The former is neutral to negative in direction, while the latter is bullish.

Mike Paulenoff is a 26-year veteran of the financial markets and author of MPTrader.com, a real-time diary of his technical chart analysis and trading alerts on all major markets. For more of Mike Paulenoff, sign up for a free 15-Day trial to his MPTrader Diary by clicking here.