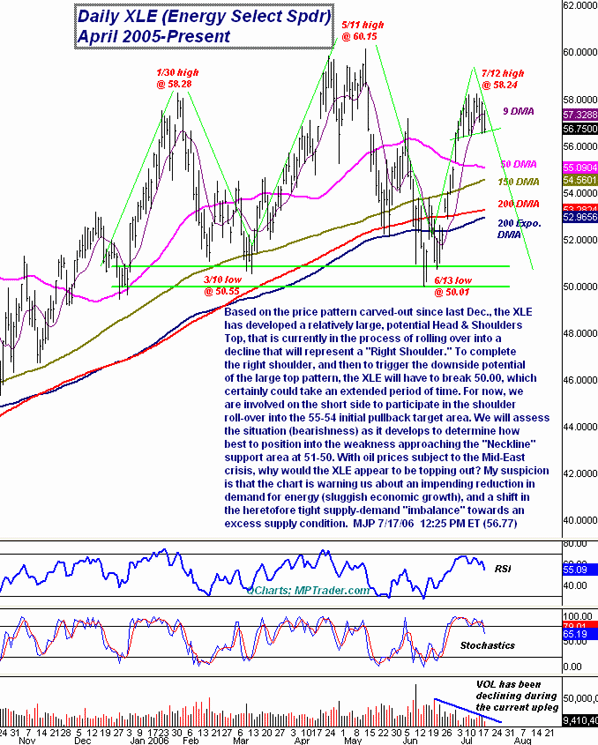
Based on the price pattern carved out since last December, the XLE has developed a relatively large potential Head and Shoulders top that is currently in the process of rolling over into a decline that will represent a "right shoulder." To complete the right shoulder and then to trigger the downside potential of the large top pattern, the XLE will have to break 50.00, which certainly could take an extended period of time. For now, we are involved on the short side to participate in the shoulder rollover into the 55-54 initial pullback target area. We will assess the situation as it develops to determine how best to position into the weakness approaching the neckline support area at 51-50. With oil prices subject to the Mideast crisis, why would the XLE appear to be topping out? My suspicion is that the chart is warning us about an impending reduction in demand for energy (sluggish economic growth), and a shift in the heretofore tight supply-demand "imbalance" towards an excess supply condition.
Mike Paulenoff is a 26-year veteran of the financial markets and author of MPTrader.com, a real-time diary of his technical chart analysis and trading alerts on all major markets. For more of Mike Paulenoff, sign up for a free 15-Day trial to his MPTrader Diary by clicking here.


 Free Festival of Traders Videos