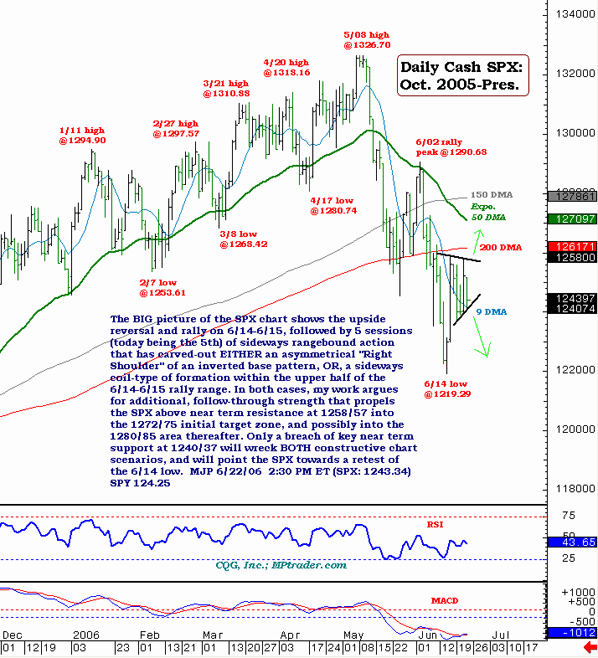
The big picture of the SPX chart shows the upside reversal and rally on June 14-15, followed by five sessions of sideways action that has carved out either an asymmetrical right shoulder or an inverted Head and Shoulders pattern, or a sideways coil type of formation within the upper half of the June 14-15 rally range. In both cases, my work argues for additional follow-through strength that propels the SPX above near-term resistance at 1258/57 into the 1272/75 initial target zone, and possibly into the 1280/85 area. Only a break of key near-term support at 1240/37 will wreck both constructive chart scenarios and will point the SPX towards a retest of the June 14 low.
Mike Paulenoff is a 26-year veteran of the financial markets and author of MPTrader.com, a real-time diary of his technical chart analysis and trading alerts on all major markets. For more of Mike Paulenoff, sign up for a free 15-Day trial to his MPTrader Diary by clicking here.


 Free Festival of Traders Videos