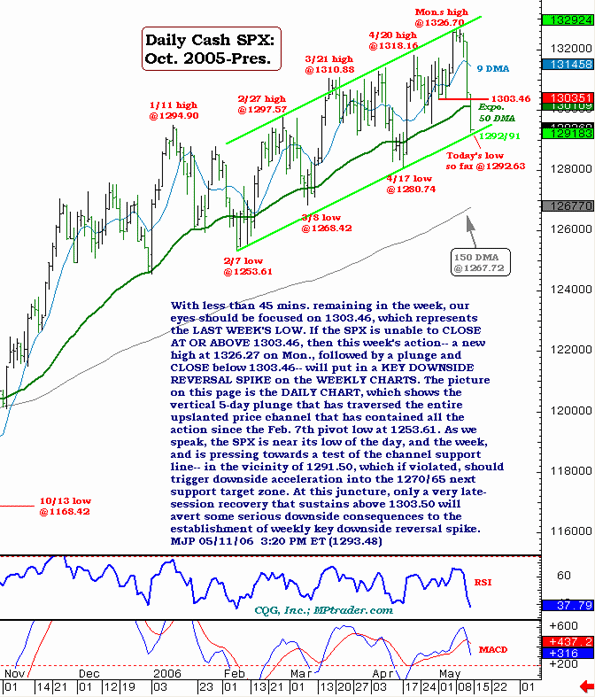
Yes, the SPX confirmed a key downside reversal week. We will have to see if the index extends its weakness immediately on Sunday evening (when futures open), or if it recovers from its extremely oversold near term condition, at which point we will access the situation for entry into short positions.
Late Friday, my eyes were focused on 1303.46, which represents the previous week's low. With the SPX closing below 1303.46, this past week's action -- a new high at 1326.27 on Monday followed by a plunge and close below 1303.46 -- put in a key downside reversal spike on the weekly charts.
The daily chart shows the vertical 5-day plunge that has traversed the entire upslanted price channel that has contained all the action since the February 7 pivot low at 1253.61. The SPX closed at the channel support line, in the vicinity of 1291.50, which if violated should trigger downside acceleration into the 1270/65 next support target zone.
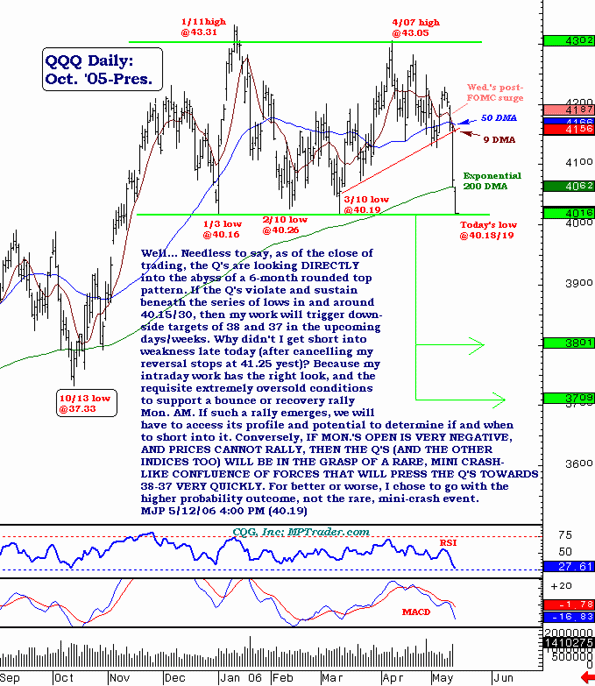
Turning our attention to the weakest of the indices, the NDX, and its ETF the Q's (QQQQ), the Q's were looking directly into the abyss of a 6-month rounded top pattern at the close of trading Friday. If the Q's violate and sustain beneath the series of lows in and around 40.15/30, then my work will trigger downside targets of 38 and 37 in the upcoming days/weeks.
My intraday work has the right look, and the requisite extremely oversold conditions, to support a bounce or recovery rally Monday morning. If such a rally emerges, we will have to access its profile and potential to determine if and when to short into it.
Conversely, if Monday's open is very negative and price cannot rally, then the Q's (and the other indices too) will be in the grasp of a rare, mini crash-like confluence of forces that will press the Q's towards 38-37 very quickly. For better or worse, I chose to go with the higher probability outcome, not the rare, mini-crash event.
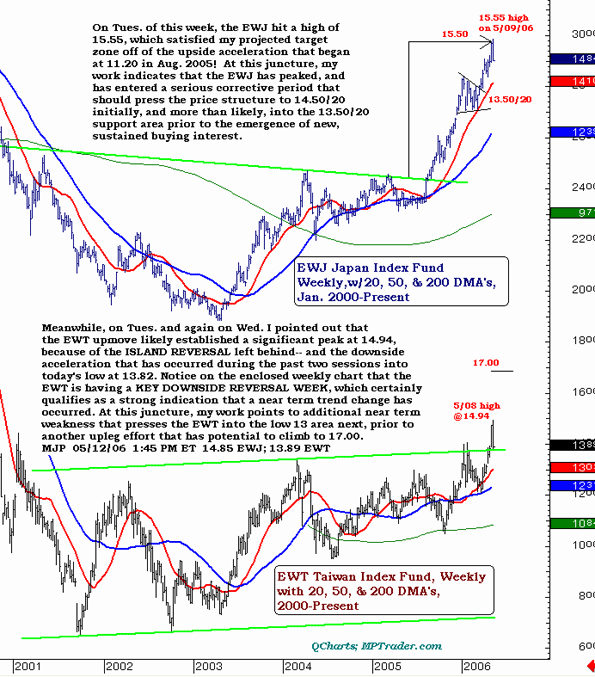
Looking internationally, during the past 10 days or so, I have exited (taken profits or stopped out) of all of my Asian long positions in CHN, EWJ, EWT, all of which are under some pressure now.
On Tuesday of this week, the EWJ hit a high of 15.55, which satisfied my projected target zone off of the upside acceleration that began at 11.20 in August 2005. At this juncture, my work indicates that the EWJ has peaked, and has entered a serious corrective period that should press the price structure to 14.50/20 initially, and more than likely, into the 13.50/20 support area prior to the emergence of new, sustained buying interest.
Meanwhile, on Tuesday and again on Wedneday, the EWT upmove likely established a significant peak at 14.94, because of the island reversal left behind and the downside acceleration that has occurred during the past two sessions into today's low at 13.82. Notice on the weekly chart that the EWT is having a key downside reversal week, which certainly qualifies as a strong indication that a near-term trend change has occurred.
At this juncture, my work points to additional near-term weakness that presses the EWT into the low 13 area next, prior to another upleg effort that has potential to climb to 17.00.
Mike Paulenoff is a 26-year veteran of the financial markets and author of MPTrader.com, a real-time diary of his technical chart analysis and trading alerts on all major markets. For more of Mike Paulenoff, sign up for a free 15-Day trial to his MPTrader Diary by clicking here.


 Free Festival of Traders Videos