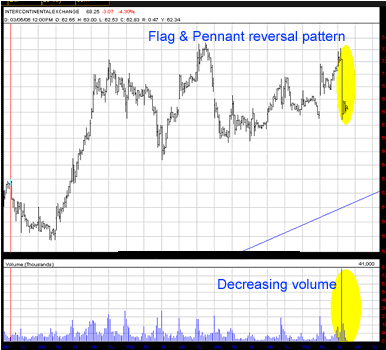
Intercontinental Exchange (ticker:ICE) has been so hot so hot since its November 2005 IPO, it may have started melting. The 20-day daily bars chart shows an upside down Flag & Pennant reversal patter. The flag pole was created on heavy volume, while the pennant formation took place on increasingly lower volume (refer to chart below). The pennant itself is a little thin, but nevertheless and indicator that cannot be ignored.

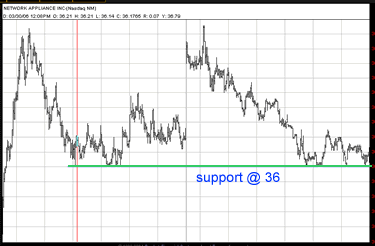
Along with the most of the market, Network Appliance Inc (NASDAQ: NTAP) showed a lot of weakness Friday. After opening into a gap to the upside on Friday, the stock almost immediately began a reversal and trended to the downside for the rest of the day. The 2-day chart shows that 36 proved to be a very solid support level for NTAP. If NTAP breaks through the 36 level on decent volume, we see a great potential to short the stock for day trading.

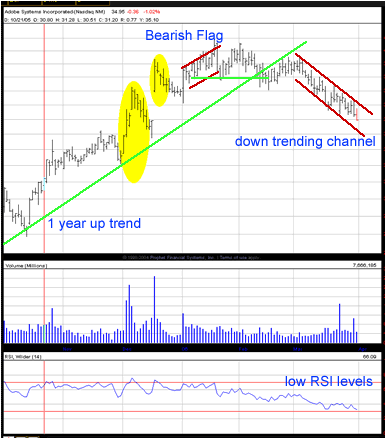
When looking at the Adobe Systems Inc (NASDAQ: ADBE) 6-month daily bars chart, here's what I see. The stock created a bullish flag (first yellow oval from the left) in December, gapped up into what kinda looks like another bullish flag (second yellow oval from the left), then took another bounce up and formed what looks to be a bearish flag (up trending channel with red lines). Since the peak of the bearish flag, it has been in a down trending channel (downward channel with red lines). It has recently passed through an intersection of the 1 year uptrend line and support level (not extremely significant support) of 38. RSI on the 1-year and 6-month charts are at low points, but this could be a nice short on a pullback to mid level RSI/channel.

Andy Swan is co-founder and head trader for DaytradeTeam.com. To get all of Andy's day trading, swing trading, and options trading alerts in real time, subscribe to a one-week, all-inclusive trial membership to DaytradeTeam by clicking here.