NavarroûÂã,˜ã"Âs Big Economic Picture: In Like a Lion, Out like a Lamb?
March weather is notorious for coming in like a lion and going out like a lamb. The stock market may pull off the same feat this year as we got a really nice rally during the first half of the month, but more and more, itûÂã,˜ã"Âs looking like the same all cross-trading market that has plagued this market periodically for months on end over the past three years.
One thing is clear: The housing market is steadily softening while the house refinancing ATM machine is now gathering rust. Everything else is far less clear.
The CPI looks tame and then the PPI looks hot. The yield curve inverts and then steepens and then inverts again. The GDP runs hot for several quarters and then cold. The unemployment rate goes down but suspicions of a growing army of discouraged workers increase. The economies of Brazil, Argentina, Japan, and Germany perk up but one wonders if they can help pull the global economic train if the U.S. falls back. China keeps barreling along but one wonders how long they can maintain such a pace in the face of rising commodity and energy prices and growing over-capacity.
These times are very interesting for an economist but lousy for a trader. Since IûÂã,˜ã"Âm both, this is part Heaven and part Hell. While I canûÂã,˜ã"Ât rule out a rocket burst rally on news like the Fed announcing an end to its current upward cycle, the reward to risk ratio seems to favor the short side. This is particularly true as we approach the ûÂã,˜é"sell in May, and go awayûÂã,˜ô Spring and summer doldrums.
This WeekûÂã,˜ã"Âs Market Movers ûÂã,˜ã More Fed Torture
At the top of the list of potential market movers must be the March Fed meeting. The smart money is betting on another quarter point hike and at least one more after that in May. Odds of this increased last week as the PPI core came out hotter than expected.
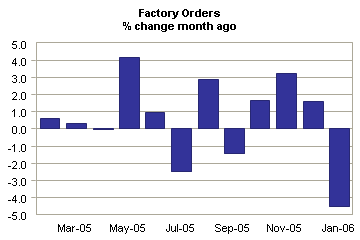
In terms of economic reports, we will get a good glimpse at the consumer with consumer confidence on Tuesday and both personal income and sentiment on Friday. Look for the revision of the GDP Q4-05 report on Thursday to possibly ripple the waters as well. That report came in absolutely anemic ûÂã,˜ã and it is suspect precisely because of that. Lastly, factory orders will be watched closely for any rebound ûÂã,˜ã they were done sharply and unexpectedly last month.
Portfolio Shorts and Longs ûÂã,˜ã XING Went the Strings
This is an absolutely miserable market to make a buck in, and IûÂã,˜ã"Âve throttled back substantially into cash. IûÂã,˜ã"Âm short QQQQ and XLF. My longs include AKSY, DVSA, HEPH, ISIS, STEM, SVA, and a new holding XING, which is a Chinese mobile phone company play that shows strong technicals. IûÂã,˜ã"Âm not enamored with any of this stuff and long for the return of some volatility.
DavioûÂã,˜ã"Âs Hedging Your Bets: ETF Frenzy
As the market continues to ebb and flow with multiple breakouts in the smaller Dow industrials and the NDX and SPX lagging, I got to thinking about the many new products that have evolved over the past half dozen years in US markets. Much like mutual fund indexing, which was the hot financial product in the 80-90ûÂã,˜ã"Âs at the heart of the Bull Market, we now have a new (!) hot product - the Exchange Traded Fund (ETF).
An ETF is a fund that tracks an index of specific sector stocks. Investors can do just about anything with an ETF that they can do with a normal stock, such as short selling. And because ETFs are traded on stock exchanges, they can be bought and sold at any time during the day (unlike most mutual funds).
The pitch you hear about ETFûÂã,˜ã"Âs is that they are more tax-efficient than normal mutual funds and that they have very low operating and transaction costs. There are no sales loads or investment minimums required to purchase an ETF. And while this all sounds find and good, I do think there is a downside in ETFûÂã,˜ã"Âs that most retail investors overlook ûÂã,˜ã a lack of liquidity.
In this regard, there are literally hundreds of ETF products that you can trade. They cover sectors ranging from Banks, Energy, and Semi Conductors to Biotechs, Domestic and Foreign Exchanges, and Gold. There is even a Commodity IndexûÂã,˜ôÎHeck, even Water and Nanotech have their own ETFûÂã,˜ã"Âs.
What I find interesting is that although some are very liquid like QQQQ, most are extremely illiquid, sometimes only trading a few thousand shares daily. The point: Watch out for the liquidity squeeze in some of these names!
More broadly, the thing that I find most interesting is that the ETFûÂã,˜ã"Âs are marketed as devices to spread and reduce risk while still providing exposure to the sector. But is this really the case? LetûÂã,˜ã"Âs look at a few of the more widely held ETFûÂã,˜ã"Âs.
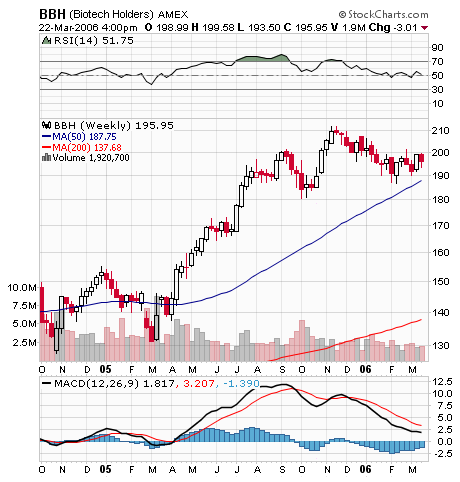
WeûÂã,˜ã"Âll start with BBH - the Biotech ETF. Is there really diversity in this index? 97.3% of this index is made up of only 10 stocks. The Top 3 names in the BBH make up 74% of the total price movement. That would be Genentech (DNA), Amgen (AMGN), and Gilead (GILD). I ask the question - what would happen if any one of those names took a header and its price dropped significantly? Of course, your biotech investment would tumble with the direct correlation between the top 3 holdings and the overall price of the index. And the same goes for the upsideûÂã,˜ôÎ.what if one of the major holdings of your favorite ETF were to experience an extreme price increase, yet within the ETF, it would be held back because of itûÂã,˜ã"Âs relation to itûÂã,˜ã"Âs lagging ETF brethren. What IûÂã,˜ã"Âm saying is that if you like those names on their own merits, go take ownership and handle the risk. But diversity and risk control is not what BBH offers its owners. I think overall you will find similar ratios across most ETFûÂã,˜ã"Âs.
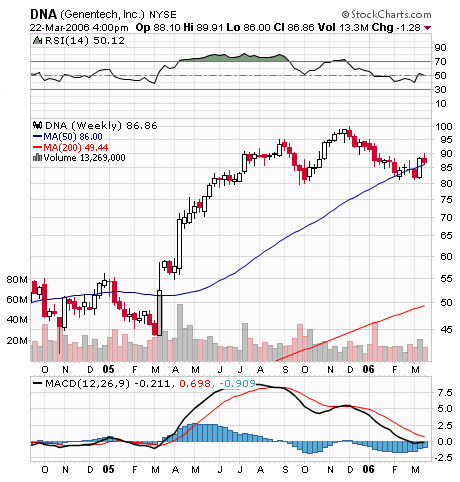
Allow me to illustrate this point with this first chart of BBH. From the chart, you can see in 2005 that BBH rose about 61% from valley to peak. Not a bad return. But now in our second chart, letûÂã,˜ã"Âs look at the top holding within BBH ûÂã,˜ã Genentech (DNA). DNA makes up 38.78% of the BBH. DNA went from $45 in early 2005 to $100 in the fall of 2005ûÂã,˜ôÎ..close to a 122% gain. And with the volatility (beta) in these names being quite similar (BBH = .977, DNA = .924), it begs the question about the benefit of ûÂã,˜é"diversifyingûÂã,˜ô with an ETF.
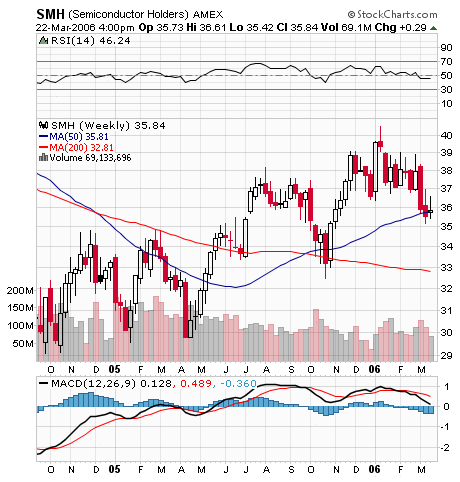
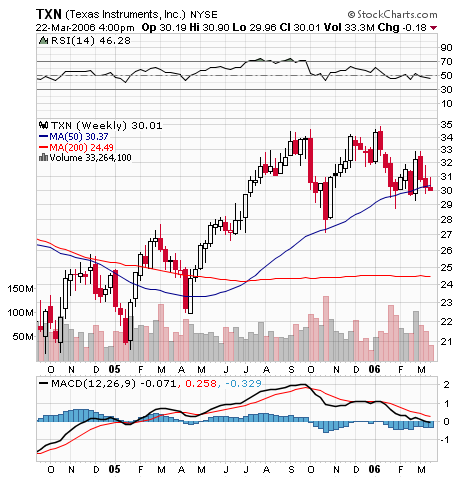
The same situation arises in the Semi Conductor Holder (SMH). The top 3 names in this index make up 48% of the pricing of this ETF. These stocks are Texas Instruments (TXN), Intel (INTC), and Applied Materials (AMAT). Again, if you think these are solid names, go own them in your own basket and hedge accordingly. In 2005, SMH had risen from valley to peak about 33%. During the same period, Texas Instruments (TXN) went up 62%. Can ya hear me knockinûÂã,˜ã"Â?
Based on this analysis, I would encourage investors to dig deeper into any ETF you might want to hold and see what makes up the funds and their weightings. You may find that truly owning one or two of the top tier firms in the ETF may work to generate the same return you are looking for without taking on unnecessary risk that could implode your returns by overlooking the makeup.
As a final note of caution, the ETFûÂã,˜ã"Âs have also become vehicles for hedge funds to spread and evaluate more complicated risk scenarios and have become in essence stand alone trading vehicles that may be more short-term oriented than the longer-term investor may be looking at. Always match your time discipline to your risk horizon when evaluating your investments. This should help evaluate better risk/reward scenariosûÂã,˜ôÎwhich is what the game is about, right?
VainoûÂã,˜ã"Âs Biotech Corner: A VRX and INSM Followup or Foul-up?
ItûÂã,˜ã"Âs never great to start the day seeing one of the stocks you recommended (and own a bunch of) at the top of the list of NYSE losers in The Wall Street Journal. ThatûÂã,˜ã"Âs what happened to me last week with Valeant Pharmaceuticals (VRX), a company I recommended in this column two weeks ago. VRX dropped from a close of $18.86 on March 20 to as low as $15 on March 21.
VRX dropped due to the announcement of the failure of its hepatitis C drug, Viramidine, to meet one of two clinical endpoints in one of two separate Phase 3 clinical trials. While Viramidine did exhibit much less toxicity (specifically anemia) than did current therapy Ribavirin, it did not match RibavirinûÂã,˜ã"Âs efficacy. VRX explained the result in that ViramidineûÂã,˜ã"Âs response rates were hurt by low dosing with respect to body weight and statistically inconsistent results outside of North America and Europe. In a conference call following the market debacle, VRX said it has filed clinical data with the SEC to support the above claims.
The Phase 3 study did provide positive proof of a weight-dependant dose response to Viramidine. In 218 patients in North America and Europe weighing less than 75 kg 62% of patients on Viramidine had no detectable HCV compared to 60% for Ribavirin. In 271 patients in North America and Europe weighing more than 75 kg, the success rate for Viramidine was 42% compared to 53% for Ribavirin. The anemia rate for those taking Ribavirin was 24% and only 5% for patients on Viramidine. These data clearly indicate that while Viramidine is much safer than Ribavarin its efficacy is dose-dependent. From a medicinal chemistry point of view, this should be obvious. However, it is not clear to me why this wasnûÂã,˜ã"Ât taken into account in the trials.
More broadly, VRX has clinical data showing it can safely dose Viramidine at higher levels. VRX is still confident it can obtain FDA approval for Viramidine late next year without completing another clinical trial. I think this is possible, at least for a second-line therapy, but not a slam-dunk.
VRX does have compelling clinical data. In patients weighing less than 75 kg the drug is a safer alternative to current treatment. I believe the FDA would approve Viramidine for patients under 75 kg, but itûÂã,˜ã"Âs unclear if they would permit such a label. In a worst case scenario the FDA will require an additional clinical study which would delay approval.
I think there are some parallels here with Amylin Pharmaceuticals (AMLN), which had some clinical setbacks in getting its drugs Byetta and Smylin approved by the FDAûÂã,˜ãboth were approved this past year. AMLN was trading near $15 last May, and is now in the $45 range. As a former shareholder (I think AMLNûÂã,˜ã"Âs tapped out at $45), but IûÂã,˜ã"Âm pretty happy with AMLN over the past few years.
My last take on VRX is this: Unlike many biotech companies, VRX is not a one-trick pony: it has actual sales. I still believe VRX is a good company. Their financials are stable, and they were not depending on this approval for their survival. My own response to TuesdayûÂã,˜ã"Âs downturn was to increase the size of my holding. VRX ended the week close to $17, so I think this was a good call. It may take a bit longer than I expected for this stock to pop, but I still think itûÂã,˜ã"Âs a good stock to own.
I also noticed another stock I recommended, Insmed (INSM), announced its auditors had expressed doubt the company could continue as a going concern. The auditors report doesnûÂã,˜ã"Ât take into account the $42M the company raised by a sale of stock on March 15, nor does it take into account expected sales of INSMûÂã,˜ã"Âs recently approved IPLEX. I re-bought INSM after it completed this secondary sale of stock on March 15 and have no immediate plans to sell below $3.
Peter Navarro is a business professor at the University of California-Irvine, and can be contacted at pn@peternavarro.com. Matt Davio is a managing partner at the hedge fund, Red Rock Capital Fund, and be contacted for hedge fund services at redrock@peternavarro.com. Andrew Vaino is a Ph.D. chemist currently teaching at The University of Maine.
DISCLAIMER: This newsletter is written for educational purposes only. By no means do any of its contents recommend, advocate or urge the buying, selling, or holding of any financial instrument whatsoever. Trading and investing involves high levels of risk. The authors express personal opinions and will not assume any responsibility whatsoever for the actions of the reader. The authors may or may not have positions in the financial instruments discussed in this newsletter. Future results can be dramatically different from the opinions expressed herein. Past performance does not guarantee future performance.


 Free Festival of Traders Videos